
- Silver is trading tepid gains and slight losses below the one-month highs hit on Monday.
- Bulls should wait for the strength above $22.00 to hold before placing further bets.
- A convincing break below the 23.6% Fibonacci level will turn the tide in favor of the bears.
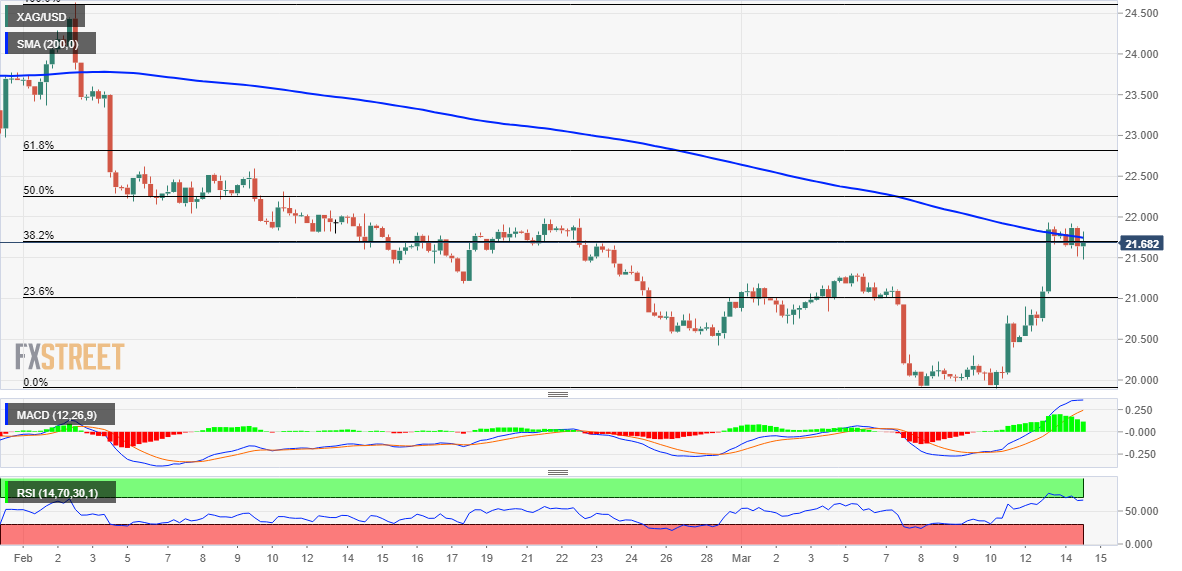
the silver reverses an early dip in the American session to the $21.50-$21.45 zone and jumps back closer to a 1-month high hit the day before. However, the white metal remains below $22.00 and currently sits around the 38.2% Fibonacci retracement level of the recent fall from the $24.65 zone, or a multi-month high hit in February.
From a technical point of view, the oscillators on the daily chart have just started to gain positive traction and support the prospects for further gains. Bulls, however, could continue to wait for a sustained move beyond the 200 SMA on the 4-hour chart before making further bets. XAG/USD could then try to break above the 50% Fibonacci level around the $22.30 zone and test the next relevant hurdle near the $22.55-$22.60 bid zone. Next, the 61.8% Fibonacci level, just before the $23.00 round level, which if broken decisively will negate any short-term bearish bias and pave the way for further short-term appreciation.
On the other hand, any weakness below the daily low, around the $21.50-$21.45 zone, could now find some support near the $21.25 zone, before $21.00, or the 23.6% Fibonacci level. The latter should act as a strong base for XAG/USD. A convincing break below will suggest that the recent rally from levels just below the psychological $20.00 level, or the yearly low touched last week, has run its course. The ensuing slide could drag XAG/USD towards the intermediate support of $19.60, en route to the round $19.00 level.
The bearish trajectory could extend further towards the $18.80-$18.75 zone before XAG/USD eventually falls to the next relevant support near the $18.30-$18.25 zone and the $18.00 level.
Silver 4 hour chart
Key levels to watch
Source: Fx Street
I am Joshua Winder, a senior-level journalist and editor at World Stock Market. I specialize in covering news related to the stock market and economic trends. With more than 8 years of experience in this field, I have become an expert in financial reporting.


