
- Silver remains under selling pressure for the second day in a row.
- The intraday technical situation supports the possibility of a retracement towards $23.00.
- A sustained strengthening above $24.00 will set the stage for further gains.
Silver extends the pullback from a three-day high and continues to lose ground for the second day in a row on Tuesday. The white metal remains depressed heading into the North American session and currently stands at the $23.50 area.
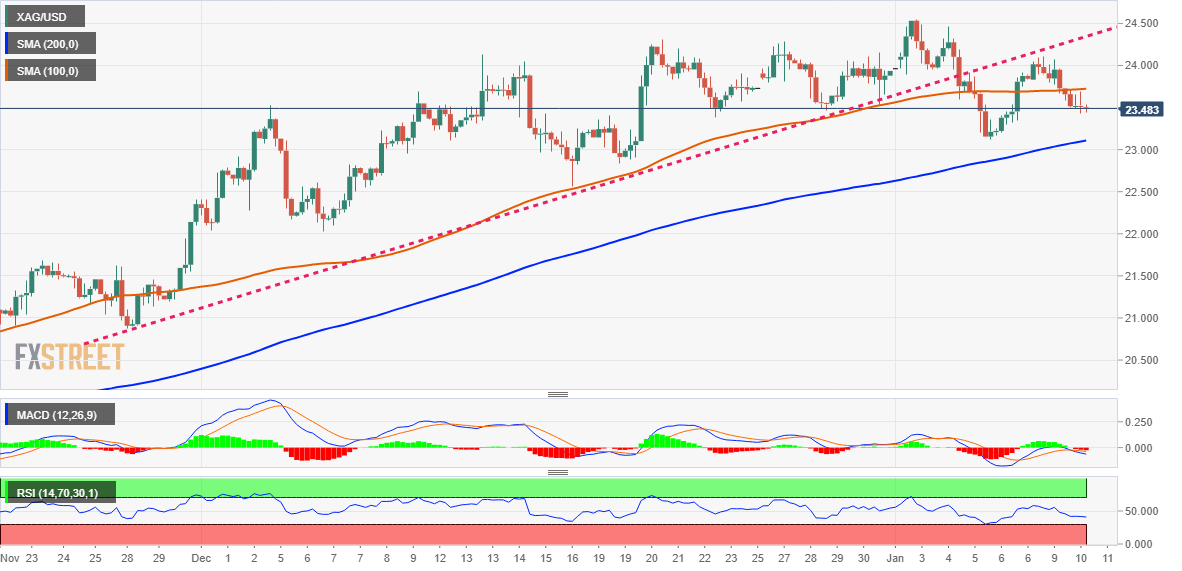
From a technical point of view, the recent bounce from the vicinity of $23.50 is teetering near the breakout point of the uptrend line from two months ago, which has now turned into resistance. The pullback below the 100 simple moving average (SMA) on the 4-hour chart favors intraday bears. Furthermore, on the hourly chart, the oscillators have once again gained negative traction and support the prospects for further losses.
Therefore, a pullback towards last week’s low is possible, around the $23.10 area. It is closely followed by the round figure of $23.00, below which XAG/USD could slide towards the $22.60/$55 zone. The next major support is near the $22.10-22.00 horizontal zone, which if broken firmly will be seen as another trigger for bears.
On the other hand, the daily high, around $23.70, seems to act as an immediate hurdle ahead of the rising trend line of $24.00 to $24.10, which has become resistance. Further sustained strength could shift the bias in favor of bullish traders. XAG/USD could then clear an intermediate hurdle near the $24.25 zone and test the multi-month high around the $24.50-$24.55 region set last week.
Some follow-through buying should pave the way for a further appreciation move in the short term towards the recovery of the psychological $25.00 zone, which it would reach for the first time since April 2022.
Silver 4 hour chart
Key levels to watch
Source: Fx Street
I am Joshua Winder, a senior-level journalist and editor at World Stock Market. I specialize in covering news related to the stock market and economic trends. With more than 8 years of experience in this field, I have become an expert in financial reporting.


