
- The price of silver falls for the second day in a row and stands at a week low.
- The technical situation favors bears and supports prospects for further losses.
- Recovery attempts above $23.00 will likely be sold.
The silver price (XAG/USD) extends the previous day’s heavy losses and remains under some selling pressure for the second day in a row on Friday. The white metal maintains its selling tone during the European session and falls to minimums of more than a week, around the area of $22.75-$22.70 in the last hour.
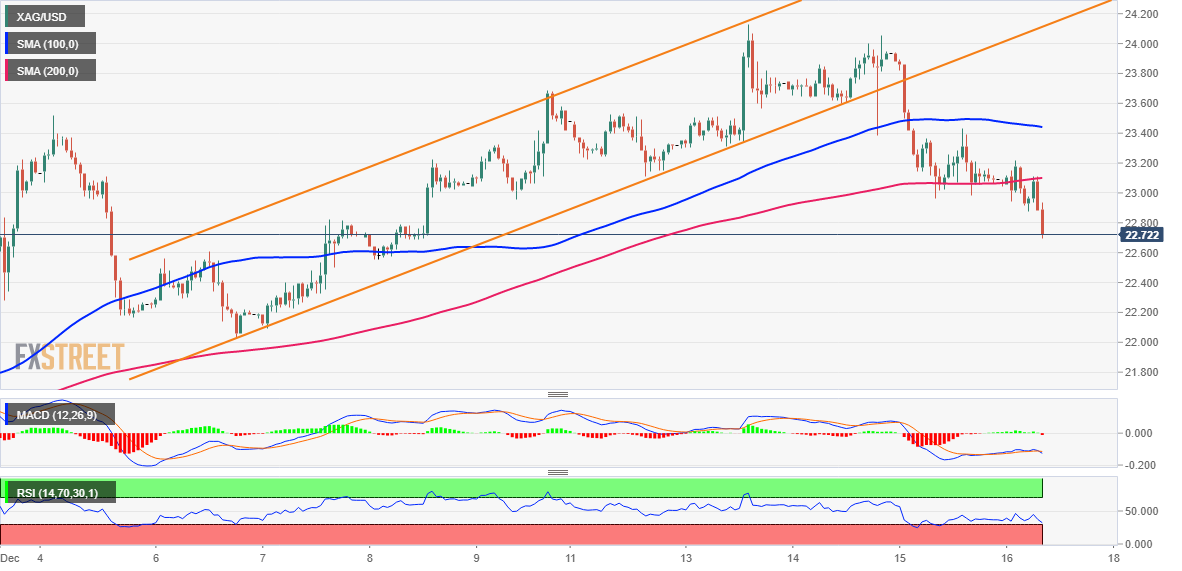
From a broader perspective, the previous day’s sustained break below a week-old rising channel and the 100-hour SMA was seen as a further trigger for bears. Furthermore, acceptance below the 200 hourly SMA, coupled with bearish oscillators on hourly charts, supports the prospects for a further short-term bearish move for XAG/USD.
That being said, the technical indicators on the daily chart, although they have been losing positive traction, remain bullish. Therefore, any further decline is likely to find decent support near the breakout point of horizontal resistance, around the $22.00 level. This level should act as a fulcrum, which if broken should pave the way for deeper losses.
On the other hand, a rally attempt above the $23.00 level (200 hourly SMA) could attract new sellers near the 100 hourly SMA between $23.40 and $23.45. Next, XAG/USD could rally to test the breakout of the ascending channel support around the $23.70 area and the $24.00 level. A convincing break through such barriers is needed to negate the negative outlook.
Silver 1 hour chart
silver key levels
Source: Fx Street
I am Joshua Winder, a senior-level journalist and editor at World Stock Market. I specialize in covering news related to the stock market and economic trends. With more than 8 years of experience in this field, I have become an expert in financial reporting.


