
- The price of Silver continues to lose ground for the third consecutive day and falls to one-week lows.
- The technical setup favors the bears and supports the prospects of a new depreciation move.
- Sustained strength above the 200-day SMA is needed to negate the negative outlook.
The price of Silver (XAG/USD) fell for the third consecutive day on Friday, also the fourth negative day of the previous five, and fell to more than one-week lows during the first half of the European session. The white metal is currently trading around the $22.65-$22.60 zone and appears vulnerable to extending this week's pullback from a high of over a month.
The recent failure to find acceptance above the technically significant 200-day SMA and subsequent decline validate the negative near-term outlook for XAG/USD. Furthermore, the oscillators on the daily chart have just started to gain negative traction and suggest that the path of least resistance for the white metal is to the downside.
From current levels, weakness below $22.50 has the potential to drag XAG/USD towards horizontal support at $22.30. Some continuation selling could expose the two-month low, around the $21.90-$21.85 area touched in January. Acceptance below the latter will be considered a new trigger for the bears and will make XAG/USD vulnerable to test the $21.40-$21.35 zone.
On the other hand, the daily high, around the $22.85 area, seems to act as an immediate hurdle before the $23.00 level. Sustained strength above this last level could lift XAG/USD to the 200-day SMA, currently near the $23.30 area. This is followed by the monthly high, around $23.50, which if exceeded will nullify the negative outlook.
XAG/USD could then try to reclaim the round $24.00 level. The momentum could extend further and allow the white metal to rally towards the next relevant hurdle near the $24.50-$24.60 region en route towards the $25.00 psychological level.
Daily Silver Price Chart
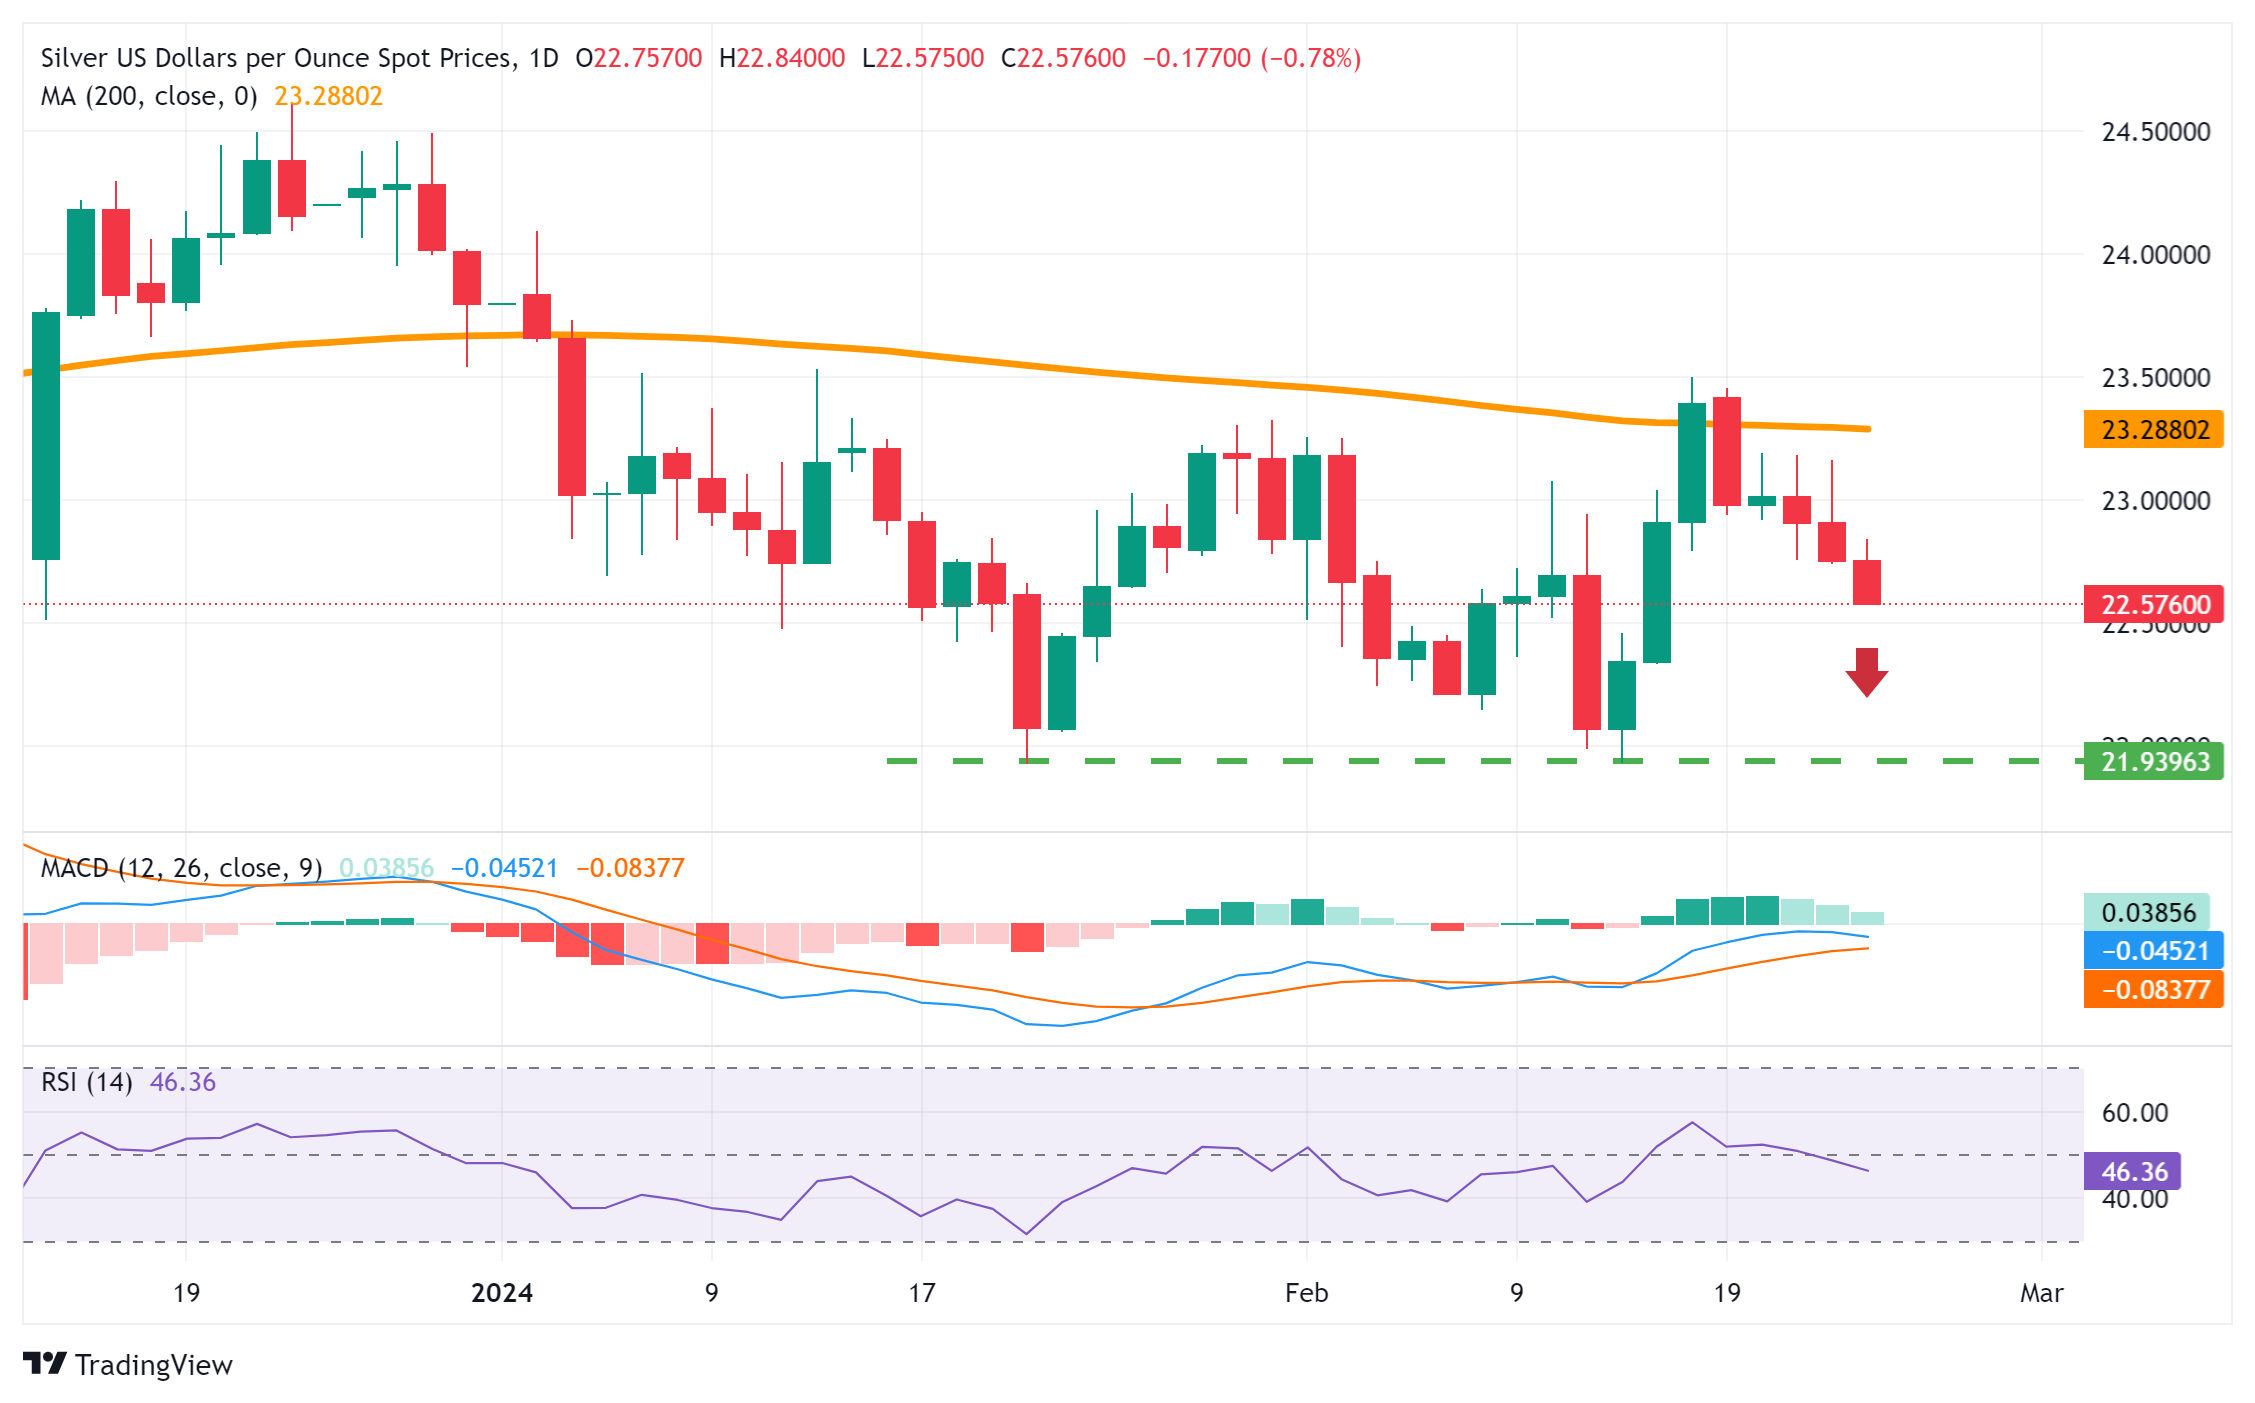
Source: Fx Street
I am Joshua Winder, a senior-level journalist and editor at World Stock Market. I specialize in covering news related to the stock market and economic trends. With more than 8 years of experience in this field, I have become an expert in financial reporting.


