
- Silver shows some resistance below $19.00 and reverses the initial decline to a multi-day low.
- The technical setup continues to favor the bears and supports the prospects for further decline in the short term.
- Sustained strength beyond the key $20.00 psychological level is needed to override the negative bias.
the silver it reverses an intraday drop to levels below $19.00, or a multi-day low, and rises to the upper end of its daily trading range. The pair XAG/USD it is currently in the $19.15 to $19.20 zone, down more than 0.20% on the day.
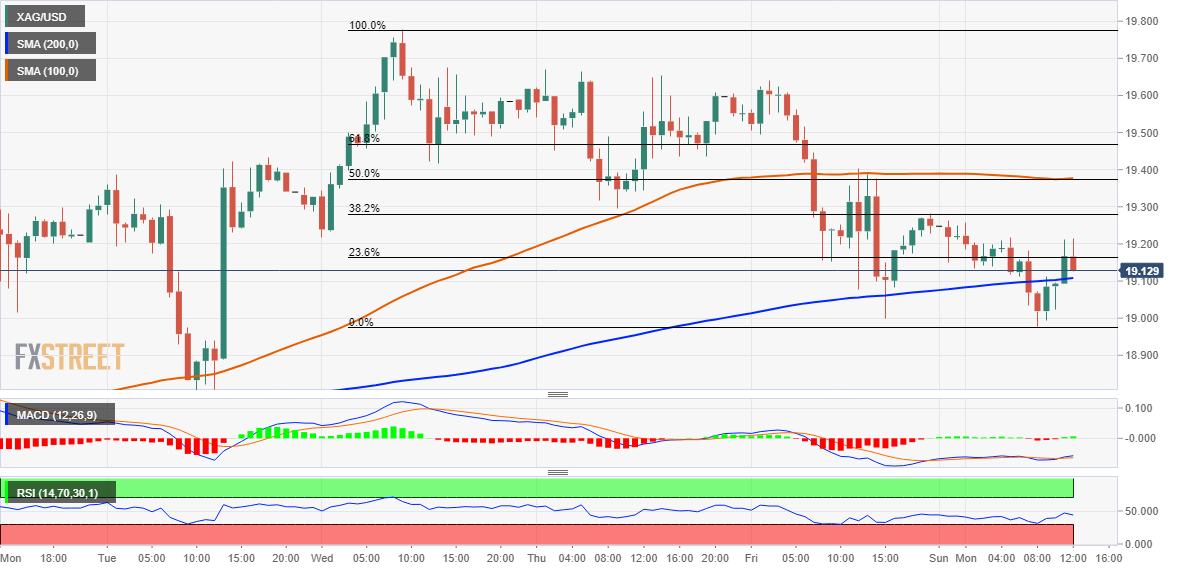
From a technical point of view, any further move to the upside is likely to face resistance near the confluence support breakout point of $19.30-$19.40. Such zone comprises the 38.2% Fibonacci retracement level of the sharp decline from the monthly high and the 100 hourly SMA, which should now act as a pivot point for intraday traders.
Sustained strength beyond that could trigger a short-covering move and allow XAG/USD to reclaim the psychological $20.00 level. The positive momentum could extend towards an intermediate hurdle near the $20.50 area, above which the bulls could target $21.00 on the way to the monthly high around the $21.25 region.
On the other hand, the $18.95-$18.90 zone coincides with the 23.6% Fibonacci level. A convincing break below will be seen as a new trigger for the bears and will expose the $18.00 signal with some intermediate support near the $18.30-$18.25 region. XAG/USD could drop further to challenge the low for the year around the $17.55 zone.
Silver 1 hour chart
Key levels to watch
Source: Fx Street
With 6 years of experience, I bring to the table captivating and informative writing in the world news category. My expertise covers a range of industries, including tourism, technology, forex and stocks. From brief social media posts to in-depth articles, I am dedicated to creating compelling content for various platforms.


