
- Silver is down for the second day in a row and is further away from the high in several months.
- The situation still favors the bulls and supports the possibility of buying the dip.
- A convincing break below the $23.00 confluence is needed to nullify the positive outlook.
Silver extends the previous day’s decline from an eight-month high and remains under some selling pressure for the second day in a row on Thursday. The white metal remains weak during the first half of the European session and currently stands around the $23.65/$23.75 zone.
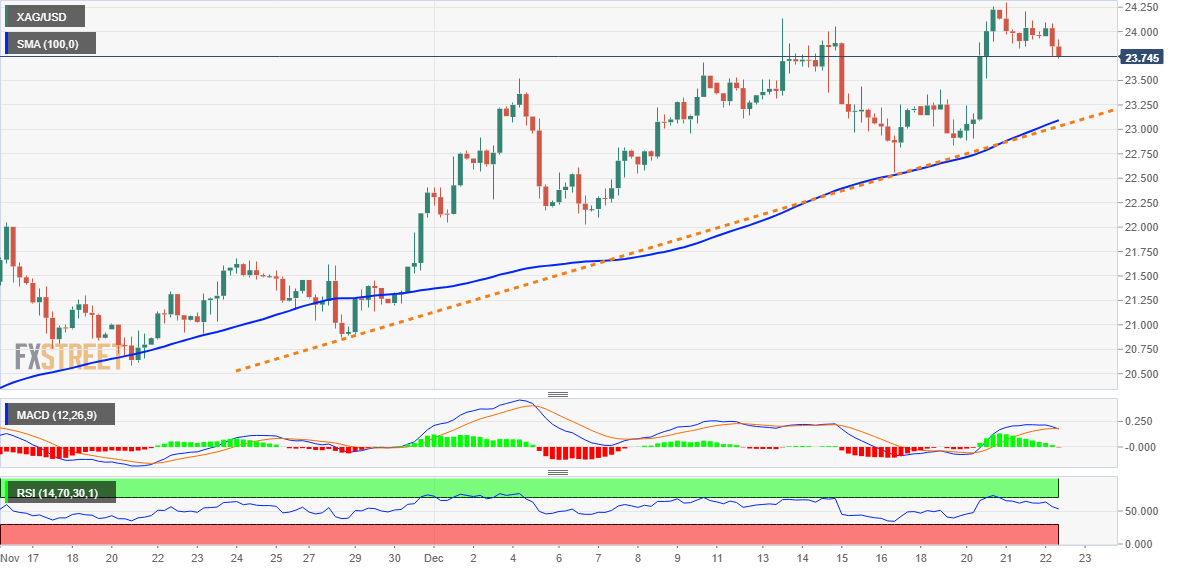
From current levels, any further decline is likely to find some support near the $23.55-$23.50 area. Extending the downside will expose the $23.00 confluence zone, which comprises the 100 SMA on the 4-hour chart and an uptrend line extending from the November low. Such an area should act as a solid base and key pivot point in determining the next leg of a directional move for XAG/USD.
Meanwhile, on the 4-hour chart, the oscillators, although they have been losing traction, remain in bullish territory. Furthermore, the positive technical indicators on the daily chart support the prospects that the dip will be seen as a buying opportunity near the aforementioned confluence support. That being said, a convincing break below would nullify the constructive outlook and shift the bias in favor of the bears.
XAG/USD could then become vulnerable and accelerate the decline to test $22.00, with some intermediate support near the $22.55/$22.50 horizontal zone. Sustained strength beyond should pave the way for further near-term gains, taking XAG/USD beyond the $24.60/$24.70 zone and allowing bulls to target a recovery from the psychological $25.00 area.
XAG/USD 4-hour chart
key levels
Source: Fx Street
I am Joshua Winder, a senior-level journalist and editor at World Stock Market. I specialize in covering news related to the stock market and economic trends. With more than 8 years of experience in this field, I have become an expert in financial reporting.


