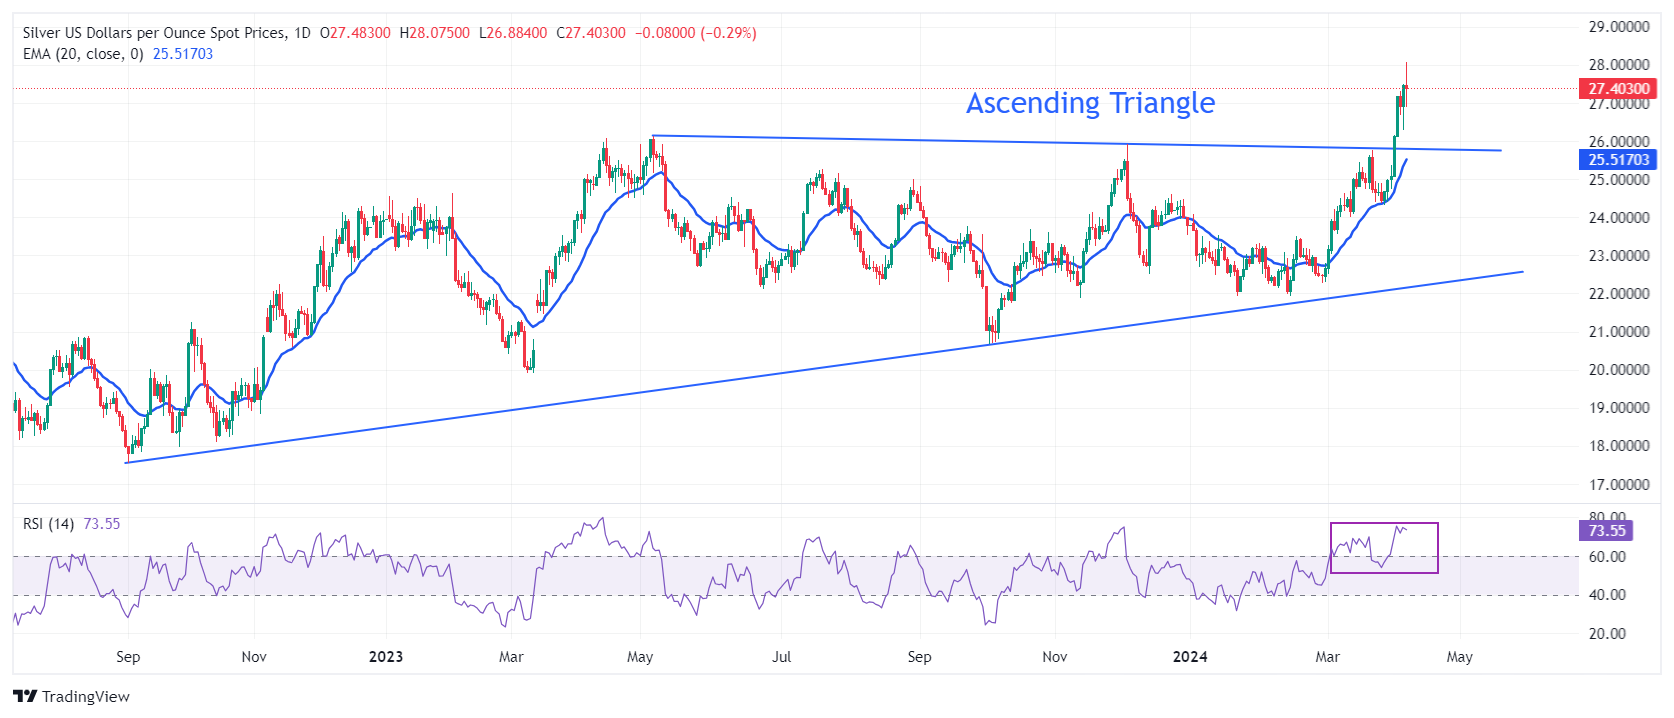
- Silver price shows strength around $28 despite traders cutting Fed rate cut bets for June.
- The Fed's Michelle Bowman said current conditions are not appropriate for lowering interest rates.
- The US dollar is awaiting US inflation data.
The price of Silver (XAG/USD) is facing nominal selling after hitting a new two-year high around $28 in the American session on Monday. Short-term demand for the white metal remains strong even as US Treasury yields soar following upbeat March Nonfarm Payrolls (NFP) data, denting speculation about a lowering of interest rates by the Federal Reserve (Fed) starting at the June meeting. the 10-year US Treasury yield rises to 4.43%.
Strong demand for labor is offset by rising wages, resulting in strong consumer spending that fuels consumer price inflation. Following the release of the US NFP, Fed Governor Michelle Bowman stated: “We have not yet reached the point where lowering the policy rate is appropriate, and I continue to see a number of upside risks to inflation.” .
Fed policymakers have reiterated that there is no urgency to lower rates. Policymakers need good inflation data for months before pivoting toward rate cuts.
The US Dollar Index (DXY) falls slightly to 104.24, but remains within Friday's trading range. The Dollar Index remains on the sidelines as attention turns to consumer price inflation data for March, due out on Wednesday.
The core CPI, which strips out food and oil price volatility, is estimated to have fallen slightly to 3.7% from 3.8%. A bigger-than-expected decline in US inflation data will boost Fed rate cut expectations for the June meeting.
Silver technical analysis
The price of Silver experiences a strong rise after the breakout of the ascending triangle formed on the daily chart. The aforementioned chart pattern shows a sharp contraction in volatility, but a decisive breakout leads to high volume and broader ticks to the upside. The horizontal resistance of the aforementioned chart pattern, located from the May 5 high at $26.13, has become a crucial support for silver price bulls.
The advance of the 20-day EMA near $25.50 keeps short-term demand strong.
The 14-period Relative Strength Index (RSI) is oscillating in the bullish range of 60.00-80.00, indicating strong upward-biased momentum.
Silver Daily Chart

XAG/USD
| Overview | |
|---|---|
| Latest price today | 27.32 |
| Today Daily variation | -0.16 |
| Today's daily variation | -0.58 |
| Today's daily opening | 27.48 |
| Trends | |
|---|---|
| daily SMA20 | 25.22 |
| 50 daily SMA | 23.84 |
| SMA100 daily | 23.73 |
| SMA200 Journal | 23.47 |
| Levels | |
|---|---|
| Previous daily high | 27.5 |
| Previous daily low | 26.29 |
| Previous weekly high | 27.5 |
| Previous weekly low | 24.75 |
| Previous Monthly High | 25.77 |
| Previous monthly low | 22.51 |
| Daily Fibonacci 38.2 | 27.03 |
| Fibonacci 61.8% daily | 26.75 |
| Daily Pivot Point S1 | 26.68 |
| Daily Pivot Point S2 | 25.88 |
| Daily Pivot Point S3 | 25.48 |
| Daily Pivot Point R1 | 27.89 |
| Daily Pivot Point R2 | 28.3 |
| Daily Pivot Point R3 | 29.1 |
Source: Fx Street
I am Joshua Winder, a senior-level journalist and editor at World Stock Market. I specialize in covering news related to the stock market and economic trends. With more than 8 years of experience in this field, I have become an expert in financial reporting.


