- The price of Silver plummets to $27.85 as speculation about the Fed's shift toward rate cuts subsides.
- US inflation data dents Fed rate cut prospects for June.
- Uncertainty increases over forecasts of three Fed rate cuts by the end of the year.
The price of Silver (XAG/USD) fell from a new two-year high of $28.36 after the US Bureau of Labor Statistics (BLS) reported that consumer price inflation is persistent. High inflation figures, combined with strong March payroll data, have dampened market expectations that the Federal Reserve (Fed) will begin lowering interest rates starting at its June meeting.
The annual headline Consumer Price Index (CPI) accelerated to 3.5%, compared to expectations of 3.4% and the previous reading of 3.2%. Annual core inflation, which excludes food and energy price volatility, rose 3.8%. Economists expected the most sought-after measure of inflation to slow to 3.7%.
Fed policymakers have been reiterating that it is not advisable to reduce interest rates until they are convinced that inflation will sustainably return to the 2% target. For inflation to return to 2%, monthly inflation would have to increase at a rate of 0.17%. In March, both headline and core CPI rose at a steady 0.4%, versus expectations of 0.3%.
Looking ahead, traders are expected to shift their bets on the Fed starting to cut interest rates in the third quarter of this year. The persistent rise in inflation is expected to accentuate uncertainty over the forecast for three rate cuts this year, as anticipated by Fed officials in the latest dot chart.
Rising CPI figures have caused yields on interest-bearing assets such as US bonds to rise sharply. The 10-year US Treasury bond yield has risen to 4.48%. The US Dollar Index (DXY) rises to the crucial resistance of 105.00.
Silver technical analysis
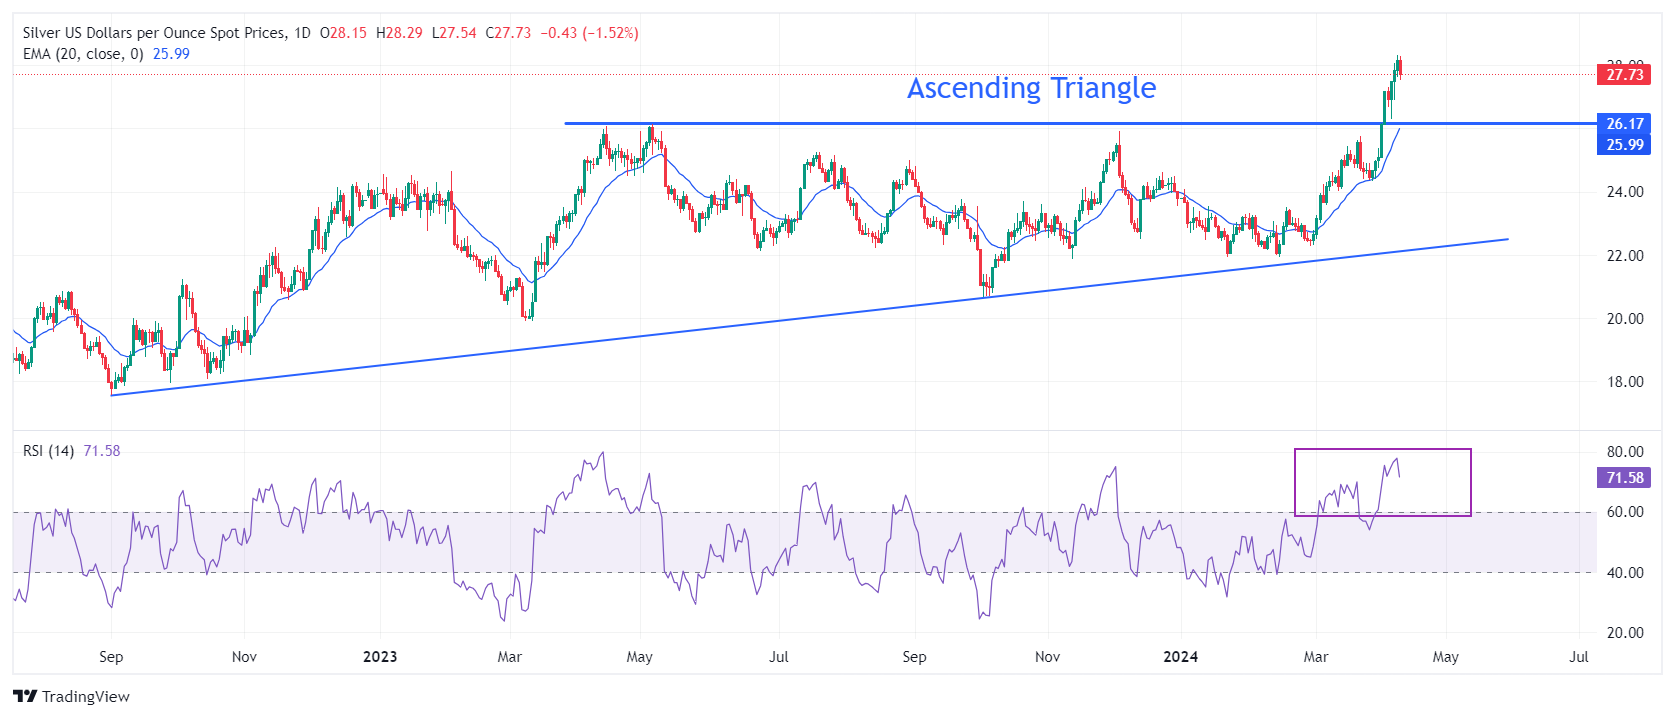
The price of silver rises strongly after the breakout of the ascending triangle formed on the daily chart. The strength of the breakout will be tested if the white metal corrects to the horizontal resistance of the aforementioned chart pattern drawn from the April 14, 2023 high of $26.09. The upward slope of the 20-day EMA at $26.00 suggests that near-term demand remains bullish.
The 14-period Relative Strength Index (RSI) falls after reaching 76.00, indicating that the oscillators are cooling down after becoming extremely overbought.
Silver Daily Chart

XAG/USD
| Overview | |
|---|---|
| Latest price today | 27.84 |
| Daily change today | -0.31 |
| Today Daily variation % | -1.10 |
| Today's daily opening | 28.15 |
| Trends | |
|---|---|
| daily SMA20 | 25.59 |
| 50 daily SMA | 24.04 |
| SMA100 daily | 23.82 |
| SMA200 Journal | 23.52 |
| Levels | |
|---|---|
| Previous daily high | 28.33 |
| Previous daily low | 27.62 |
| Previous weekly high | 27.5 |
| Previous weekly low | 24.75 |
| Previous Monthly High | 25.77 |
| Previous monthly low | 22.51 |
| Daily Fibonacci 38.2 | 28.06 |
| Fibonacci 61.8% daily | 27.89 |
| Daily Pivot Point S1 | 27.74 |
| Daily Pivot Point S2 | 27.33 |
| Daily Pivot Point S3 | 27.03 |
| Daily Pivot Point R1 | 28.45 |
| Daily Pivot Point R2 | 28.74 |
| Daily Pivot Point R3 | 29.15 |
Source: Fx Street
I am Joshua Winder, a senior-level journalist and editor at World Stock Market. I specialize in covering news related to the stock market and economic trends. With more than 8 years of experience in this field, I have become an expert in financial reporting.


