
- The price of silver falls for the second day in a row, albeit with no further selling.
- The technical situation favors the bulls and supports the prospects for further gains.
- Dips could be seen as a buying opportunity near the breakout of $24.40/$30.
Silver (XAG/USD) is trading with a slight negative bias for the second day in a row on Wednesday, though the lack of continuation selling warrants some caution for aggressive bears. The white metal manages to stay above the previous day’s low and is around the $24.80-$24.85 zone during the early stages of the European session.
From a technical point of view, the decline could only be attributed to profit taking amid a slightly overbought Relative Strength Index (RSI) on the daily chart. That being said, this week’s sustained move and acceptance above the strong $24.30-$24.40 horizontal barrier is seen as another trigger for bulls. On the other hand, XAG/USD has, so far, managed to hold above the previous year high, around the $24.65 zone, and looks set to continue its recent bull run witnessed over the last month.
Therefore, any further pullback is likely to attract new buyers and remain capped near the breakout of previous resistance at $24.40-$24.30, which has now turned support. Such an area should now act as a turning point, which if broken decisively could trigger some technical selling and make XAG/USD vulnerable to weakening below the $24.00 level towards testing the weekly lows around to the zone of $23.60-$23.55. The corrective slide could extend further towards the $23.15 intermediate support on the way to the $23.00 round level.
Bulls, for their part, could wait for buying above the $25.10-$25.15 zone, or the near-year high reached on Wednesday, before opening new positions. XAG/USD could then try to break through an intermediate barrier near the $25.35-$25.40 zone and recapture the $26.00 level for the first time since April 2022. The next major hurdle lies near the $26.20 zone, ahead of the $26.40-$26.50 region and the 2022 high just ahead of the $27.00 level.
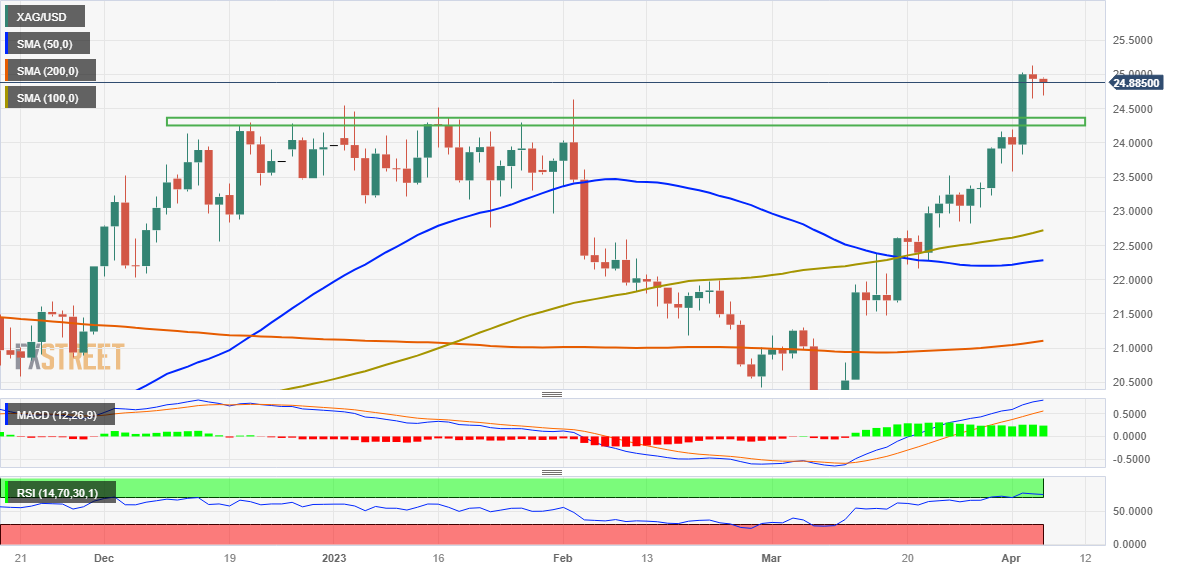
silver daily chart
Silver additional technical levels
Source: Fx Street
I am Joshua Winder, a senior-level journalist and editor at World Stock Market. I specialize in covering news related to the stock market and economic trends. With more than 8 years of experience in this field, I have become an expert in financial reporting.


