
- XAG/USD falls on risk appetite and technical factors as a dragonfly doji emerges.
- If XAG/USD falls below $22.00, sellers would face support roadblocks in the $21.80-$90 zone.
- XAG/USD Price Analysis: Consolidating around levels known prior to the FOMC decision.
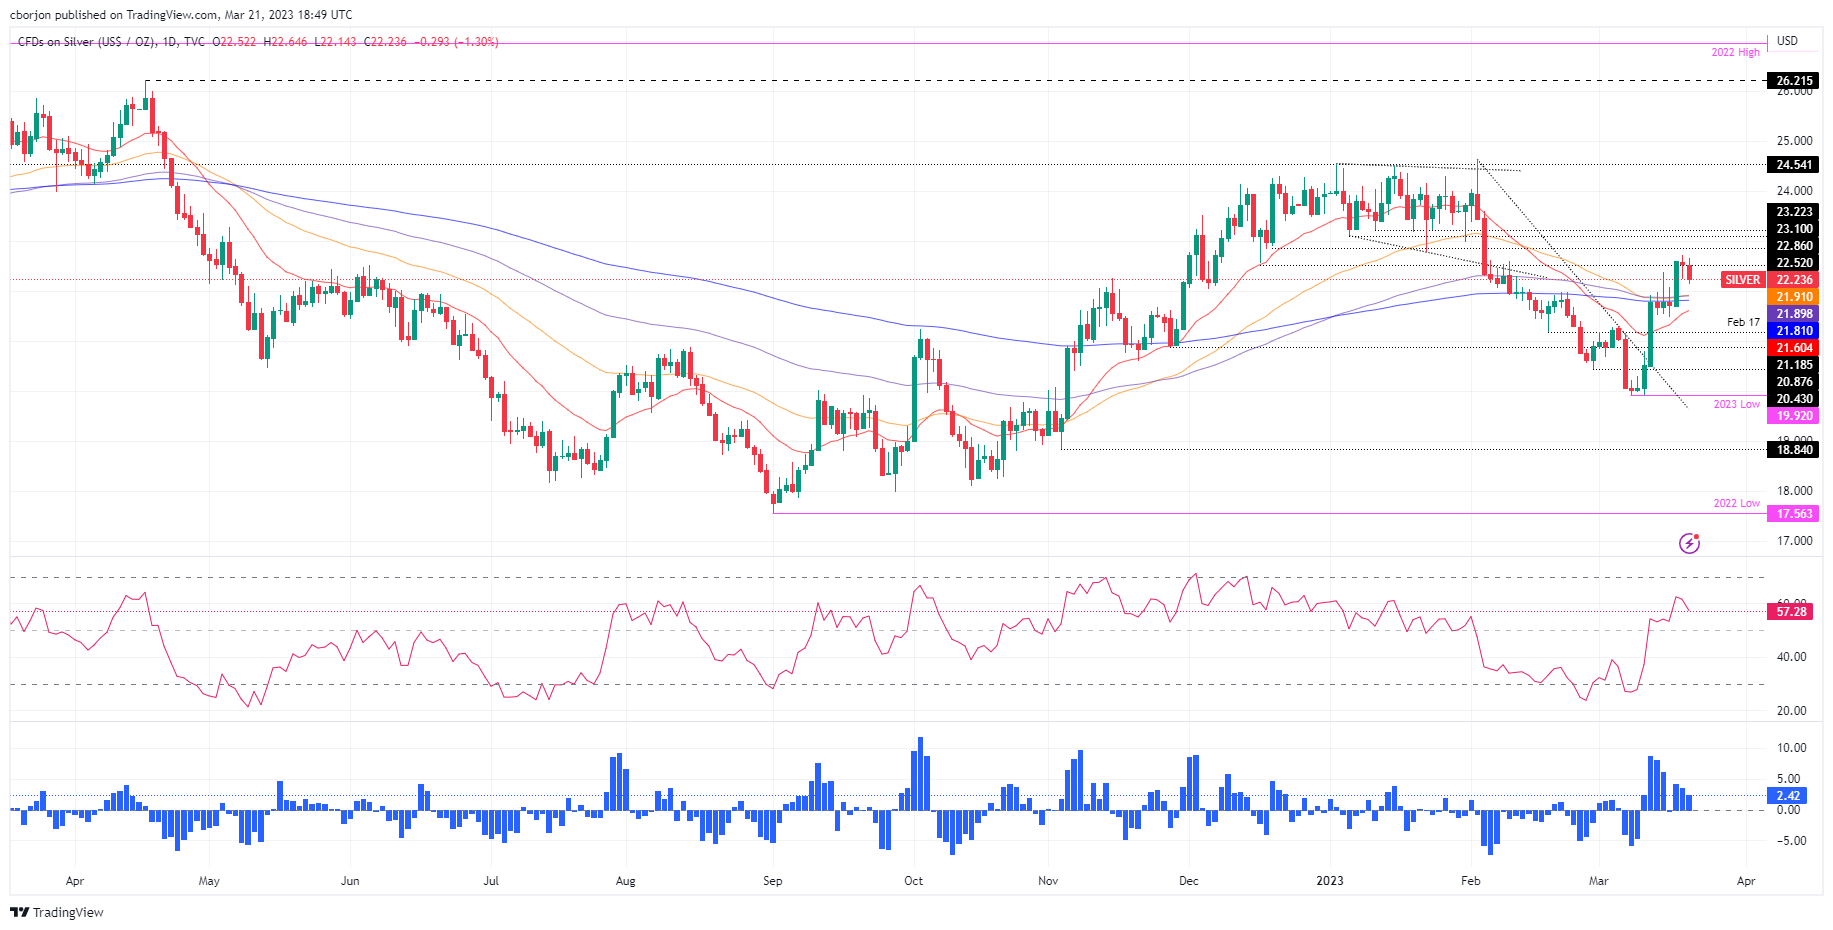
the price of silver reversed its bullish course, falling around 1.20% late in the session. After reaching a seven-week high of $22.71 on Monday, the XAG/USD pair has retraced some of those gains and is trading near the March 20 daily low of $22.22. At the time of writing, XAG/USD was trading at $22.29, down 0.27% on the day.
XAG/USD Price Action
The week began with the white metal printing a fresh multi-week high before reversing and closing above $22.50. On its way north, XAG/USD recaptured the 200 day EMA, shifting the bias of the white metal to neutral to the upside. However, a dragonfly doji emerged on the daily, exacerbating silver’s slide towards the $22.20 zone.
If the XAG/USD falls below $22.00, this would pave the way for a drop towards the 50-day EMA at $21.91, immediately followed by the 100-day EMA at $21.89. Once broken, the 200 day EMA at $21.81 would be next, before falling back to the 20 day EMA at $21.60.
Conversely, the first resistance for XAG/USD would be the March 17 daily high at $22.59, followed by the March 20 high at $22.71. Upside risks remain above $23.00.
XAG/USD Daily Chart
XAG/USD Technical Levels
Source: Fx Street
I am Joshua Winder, a senior-level journalist and editor at World Stock Market. I specialize in covering news related to the stock market and economic trends. With more than 8 years of experience in this field, I have become an expert in financial reporting.


")


