
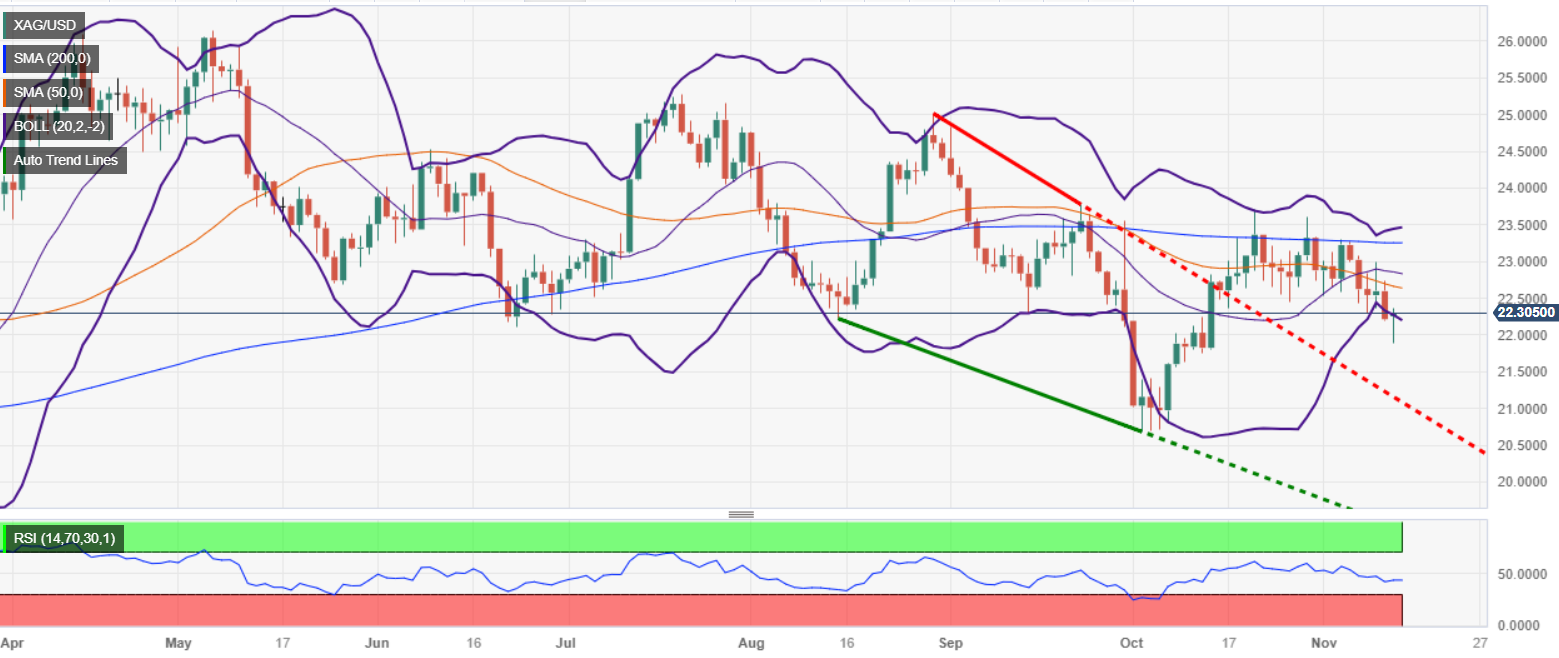
- Silver prices recover and are trading around $22.32 per ounce, which represents an advance of 0.27% after hitting five-week lows at $21.88.
- Technical analysis reveals a neutral bearish bias, but the formation of a “hammer” pattern on the daily chart suggests possible bullish momentum.
- For a bullish turn, silver needs to break above the 50-day moving average (DMA) at $22.65, aiming for the 200-DMA at $23.25 and the October 20 high at $23.69.
The price of the Silver finds its footing and rises after hitting five-week lows at $21.88 on Monday, and exchanges hands around $22.32 a troy ounce, late in the North American session, printing gains of 0.27%, at the time of writing lines.
From a technical point of view, the gray metal has a neutral to bearish bias, but the daily chart shows that the price action is forming a “hammer”, which is usually a bullish signal, after recording a series of seven consecutive days with lower highs and lower lows, which ended on Monday.
Therefore, for XAG/USD to turn bullish, buyers must initially reclaim the 50-day moving average (DMA) at $22.65. A break of the latter would expose the 200-DMA at $23.25, followed by the October 20 last cycle high at $23.69. Once surpassed, a bullish resumption would occur.
On the other hand, a drop below the October 13 low at $21.87 would solidify a bearish case, with the next target for sellers being the October 4 swing low at $20.69, followed by the year-to-date low at $19.90. $.
XAG/USD Price Analysis – Daily Chart
XAG/USD Technical Levels
Source: Fx Street
I am Joshua Winder, a senior-level journalist and editor at World Stock Market. I specialize in covering news related to the stock market and economic trends. With more than 8 years of experience in this field, I have become an expert in financial reporting.


