- The price of Silver rebounds to $28.50, even though investors hope that tensions in the Middle East will not continue to increase.
- US bond yields rebound amid uncertainty over Fed rate cut schedule.
- Encouraging US retail sales boost demand for the US Dollar.
Silver price (XAG/USD) finds strong buying interest near $27.50 after correcting from new highs of $29.80. The white metal rebounds to $28.50 in the US session on Monday, but struggles to prolong the recovery as investors hope tensions in the Middle East do not escalate further.
Iran said we do not want to further escalate tensions in the Middle East. However, if the Israeli regime makes another mistake, Iran's response will be considerably more severe, the Wall Street Journal reported. Meanwhile, US President Joe Biden stated that he will not support Israel's counterattack. On Saturday, Iran launched hundreds of drones and missiles against the Israeli state.
Meanwhile, rising bond yields due to growing uncertainty about when the Federal Reserve (Fed) will focus on rate cuts is locking the price of Silver from further upside. the yield on the 10-year US Treasury bond rises to 4.65%.
The US Dollar Index (DXY) extends its gains to 106.20 following encouraging US retail sales data for March. The US Census Bureau reported that retail sales rose 0.7%, compared to expectations of 0.3%, but the pace was slower than the previous reading of 0.9%, revised up from 0.6%.
Silver technical analysis
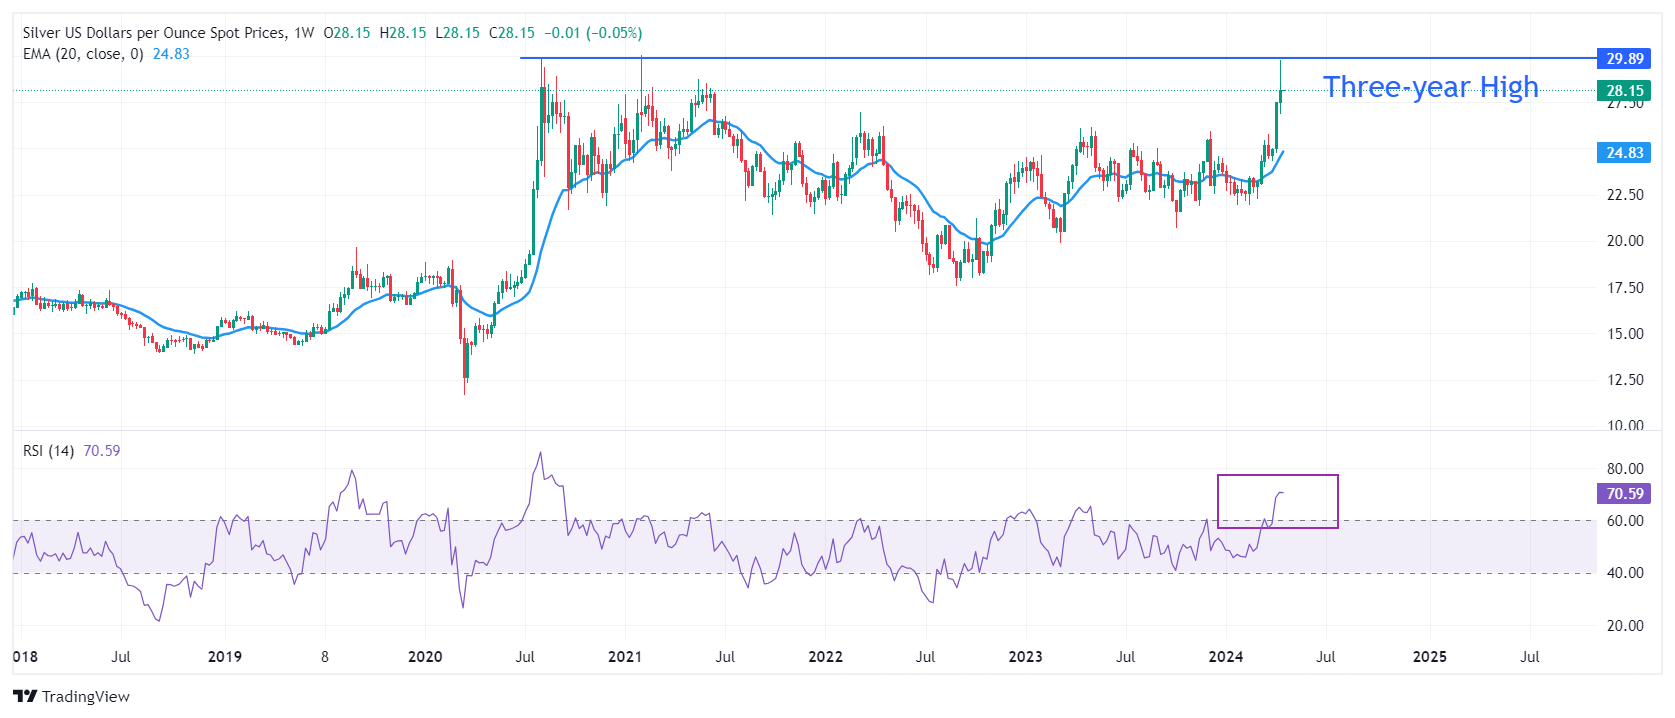
The price of Silver recovers a three-year high near $30.00. The long-term outlook for the Silver price is extremely bullish, as the 20-week EMA near $25.00 is tilted higher. The 14-period Relative Strength Index (RSI) is moving towards the bullish range of 60.00-80.00, suggesting that there is active bullish momentum.
Silver Weekly Chart

XAG/USD
| Overview | |
|---|---|
| Latest price today | 28.25 |
| Today Daily Change | 0.37 |
| Today's daily variation | 1.33 |
| Today daily opening | 27.88 |
| Trends | |
|---|---|
| daily SMA20 | 26.1 |
| 50 daily SMA | 24.34 |
| SMA100 daily | 23.95 |
| SMA200 Journal | 23.6 |
| Levels | |
|---|---|
| Previous daily high | 29.8 |
| Previous daily low | 27.88 |
| Previous weekly high | 29.8 |
| Previous weekly low | 26.88 |
| Previous Monthly High | 25.77 |
| Previous monthly low | 22.51 |
| Daily Fibonacci 38.2 | 28.61 |
| Fibonacci 61.8% daily | 29.07 |
| Daily Pivot Point S1 | 27.24 |
| Daily Pivot Point S2 | 26.6 |
| Daily Pivot Point S3 | 25.32 |
| Daily Pivot Point R1 | 29.16 |
| Daily Pivot Point R2 | 30.44 |
| Daily Pivot Point R3 | 31.08 |
Source: Fx Street
I am Joshua Winder, a senior-level journalist and editor at World Stock Market. I specialize in covering news related to the stock market and economic trends. With more than 8 years of experience in this field, I have become an expert in financial reporting.


