
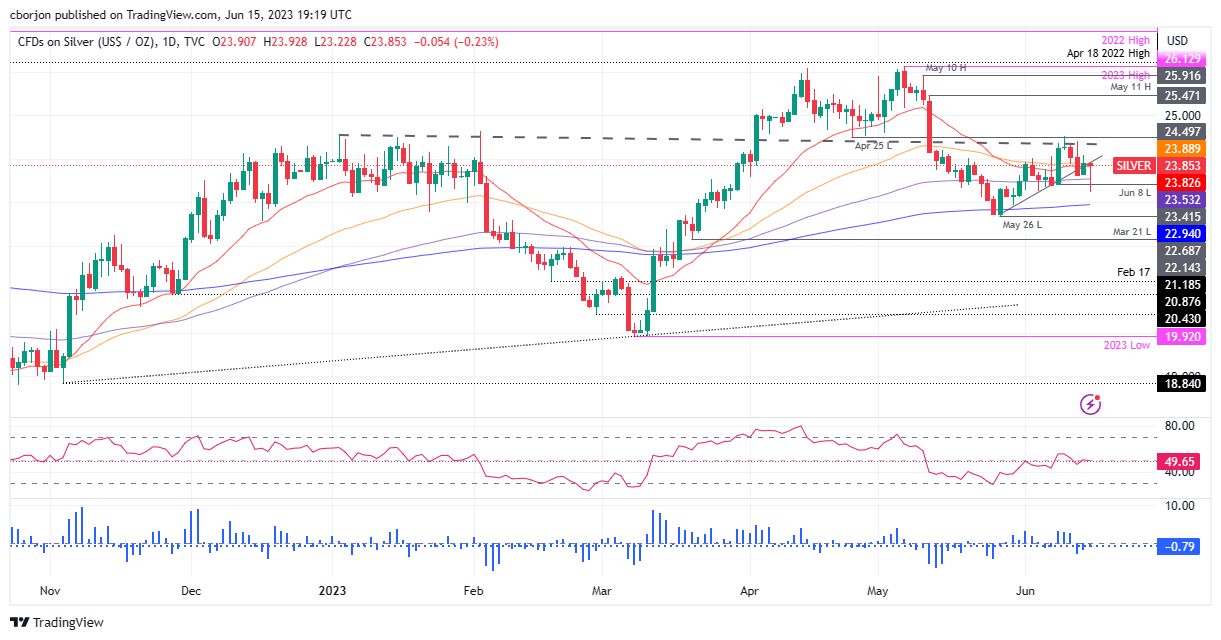
- The XAG/USD pair finds resistance and trades at $23.82, shedding 0.36% amid weakening US Treasury yields.
- Despite the bearish bias, a break of the daily high on June 9 could turn silver trend neutral to the upside.
- Oscillators are predicting short-term declines, indicating that sellers continue to control the market.
The silver price erases some of its previous losses, showing that the XAG/USD pair hit a two-week low of $23.22 before reversing direction. However, the XAG/USD rally stalled in a resistance zone, with several technical indicators capping the upside. At the time of writing these lines, XAG/USD is trading at $23.82, down 0.36%.
XAG/USD Price Analysis: Technical Perspective
XAG/USD maintains a neutral bias, leaning to the downside, as the white metal fails to recapture the April 25 swing low at $24.49, a turning point that may pave the way for further gains. It must be said that silver failed to recover, despite a drop in US Treasury yields. Therefore, the short-term momentum in XAG/USD could be fading, warranting a move. bearish resumption.
On the downside, XAG/USD would find first support at the 100-day EMA at $23.53, which, once broken, would put $23.00 at risk. A break below, and the 200 day EMA will be in play at $22.94 before challenging the May 26 low at $22.68, with further decline beyond the latter expected.
Conversely, XAG/USD must break the June 9 daily high for a bullish resumption at $24.52. Breaking above would put a higher trading range into play and turn silver bias to neutral to the upside. The next resistance would be $25.00, followed by the May 11 high at $25.47.
However, oscillators suggest more to the downside is expected in the near term, with the RSI in a bearish zone and the 3-Day Rate of Exchange (RoC) portraying sellers still in control.
XAG/USD Price Action – Daily Chart
Source: Fx Street
I am Joshua Winder, a senior-level journalist and editor at World Stock Market. I specialize in covering news related to the stock market and economic trends. With more than 8 years of experience in this field, I have become an expert in financial reporting.


