
- The silver market consolidates in a tight range below the $24.00 level on Friday.
- Recent price movements in both directions warrant some caution before entering directional positions.
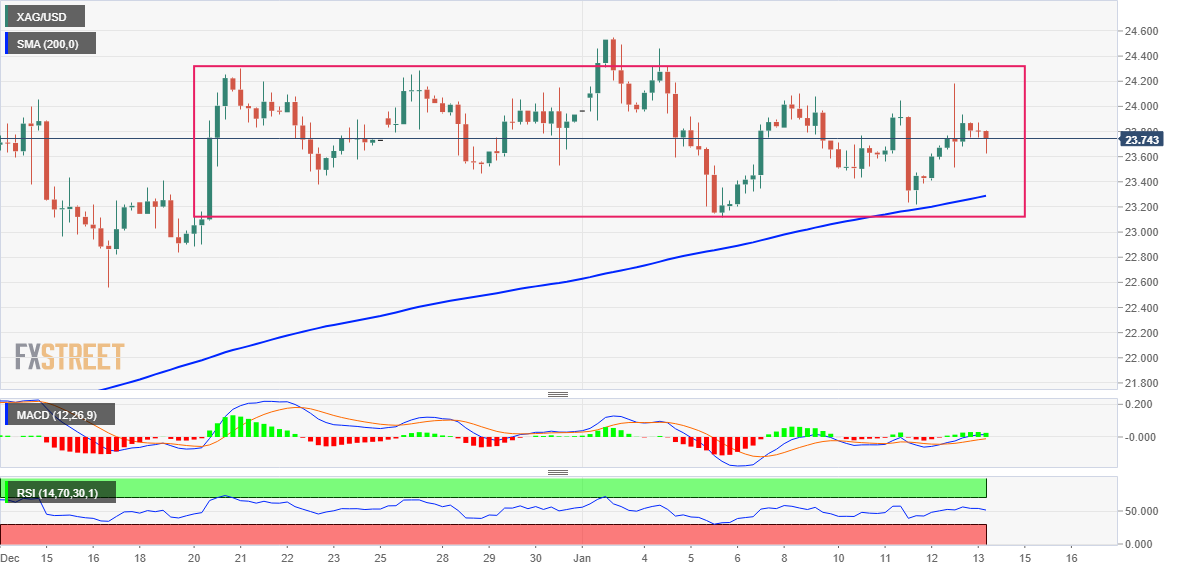
- A convincing break below the 200 SMA on the 4-hour chart should pave the way for deeper losses.
The silver price (XAG/USD) struggles to gain significant traction on Friday and is trading in a tight range at the start of the European session. The white metal is currently sitting around the $23.75 area, almost unchanged on the day, and remains within a broader range it has held for the past three weeks or so.
From a technical standpoint, the repeated failures this week to find acceptance above the round $24.00 level warrant some caution on the part of the bulls. However, XAG/USD has managed to hold above the 200 SMA on the 4-hour chart. The latter is currently near the $23.20 zone and coincides with the lower end of the trading range, which in turn should now act as a key point for short-term traders.
A convincing break below that level will mark a break down, although it will be prudent to wait for selling below the $23.00 round level before positioning for a further move lower. In that case, XAG/USD could extend the recent pullback from a multi-month high and accelerate the decline towards the $22.60-$22.55 zone. Further down, the decline could drag the price down to the next relevant support near the $22.10-$22.00 area.
On the other hand, any positive intraday move above the $24.00 level could face some resistance near the previous day’s high, around the $24.20 region. This is followed by a multi-month high around the $24.50 area – $24.55 hit last week, which if broken decisively will be seen as another trigger for bulls. Higher up, XAG/USD could try to recapture the psychological $25.00 level for the first time since April 2022.
Silver 4 hour chart
Silver additional technical levels
Source: Fx Street
I am Joshua Winder, a senior-level journalist and editor at World Stock Market. I specialize in covering news related to the stock market and economic trends. With more than 8 years of experience in this field, I have become an expert in financial reporting.


