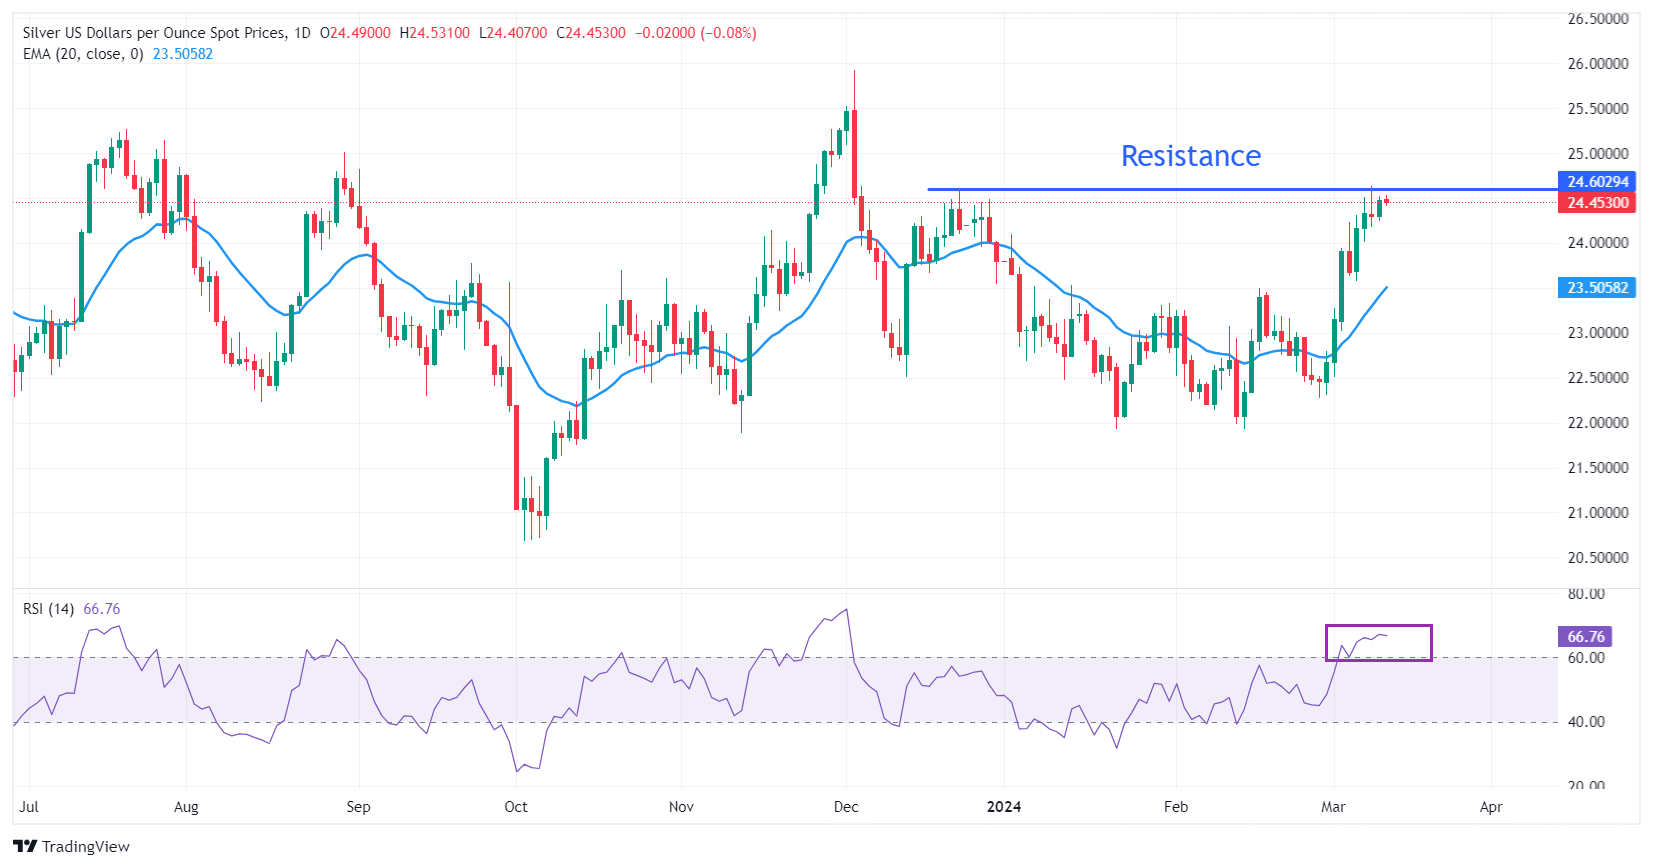
- The price of Silver consolidates around $24.50 pending US inflation data.
- The US core CPI is expected to slow, while headline inflation could remain persistent.
- Silver price needs a new trigger for a decisive break above $24.60.
The price of silver (XAG/USD) is trading in a tight range around $24.50 during the European session on Tuesday. The white metal has failed to find a direction since Friday's session. XAG/USD is expected to break out of its sideways trend following the release of US Consumer Price Index (CPI) data for February, which will be released at 12:30 GMT.
Monthly headline inflation is expected to have increased by 0.4%, up from 0.3% in January. In the same period, core inflation, which eliminates the volatility of food and energy prices, would grow at a slower pace of 0.3%, compared to 0.4% previously. On a year-on-year basis, economists expect headline CPI to remain stable at 3.1% and core inflation to slow to 3.7% from 3.9% in January.
Market expectations for Federal Reserve (Fed) rate cuts at the June monetary policy meeting will be greatly influenced by the release of inflation data.
Pending data on US consumer price inflation, market sentiment is quite bullish. S&P 500 futures posted significant gains in the London session, reflecting increased risk appetite among market participants, while the 10-year US Treasury yield fell to 4.10%. The DXY Dollar Index is trading within Monday's trading range around 102.80.
Technical analysis of the price of Silver
Silver price is moving sideways after testing the horizontal resistance drawn from the December 22 high at $24.60. The general trend is bullish, however, a correction movement is expected before a new upward movement. The advance of the 20-day EMA near $23.50 indicates that short-term demand is bullish.
The 14-period Relative Strength Index (RSI) is oscillating in the bullish range of 60-80, indicating that bullish momentum has already been triggered.
Daily Silver Price Chart
XAG/USD technical levels
| Overview | |
|---|---|
| Latest price today | 24.43 |
| Today Daily variation | -0.04 |
| Today's daily variation | -0.16 |
| Today's daily opening | 24.47 |
| Trends | |
|---|---|
| daily SMA20 | 23.17 |
| 50 daily SMA | 22.96 |
| SMA100 daily | 23.3 |
| SMA200 Journal | 23.29 |
| Levels | |
|---|---|
| Previous daily high | 24.52 |
| Previous daily low | 24.24 |
| Previous weekly high | 24.64 |
| Previous weekly low | 23.02 |
| Previous Monthly High | 23.5 |
| Previous monthly low | 21.93 |
| Daily Fibonacci 38.2 | 24.42 |
| Fibonacci 61.8% daily | 24.35 |
| Daily Pivot Point S1 | 24.3 |
| Daily Pivot Point S2 | 24.13 |
| Daily Pivot Point S3 | 24.02 |
| Daily Pivot Point R1 | 24.58 |
| Daily Pivot Point R2 | 24.7 |
| Daily Pivot Point R3 | 24.87 |
Source: Fx Street
I am Joshua Winder, a senior-level journalist and editor at World Stock Market. I specialize in covering news related to the stock market and economic trends. With more than 8 years of experience in this field, I have become an expert in financial reporting.


