
- The price of Silver extends the heavy losses of the previous day and approaches the two-month low set in December.
- The technical situation favors the bears and supports the prospects for further losses in the short term.
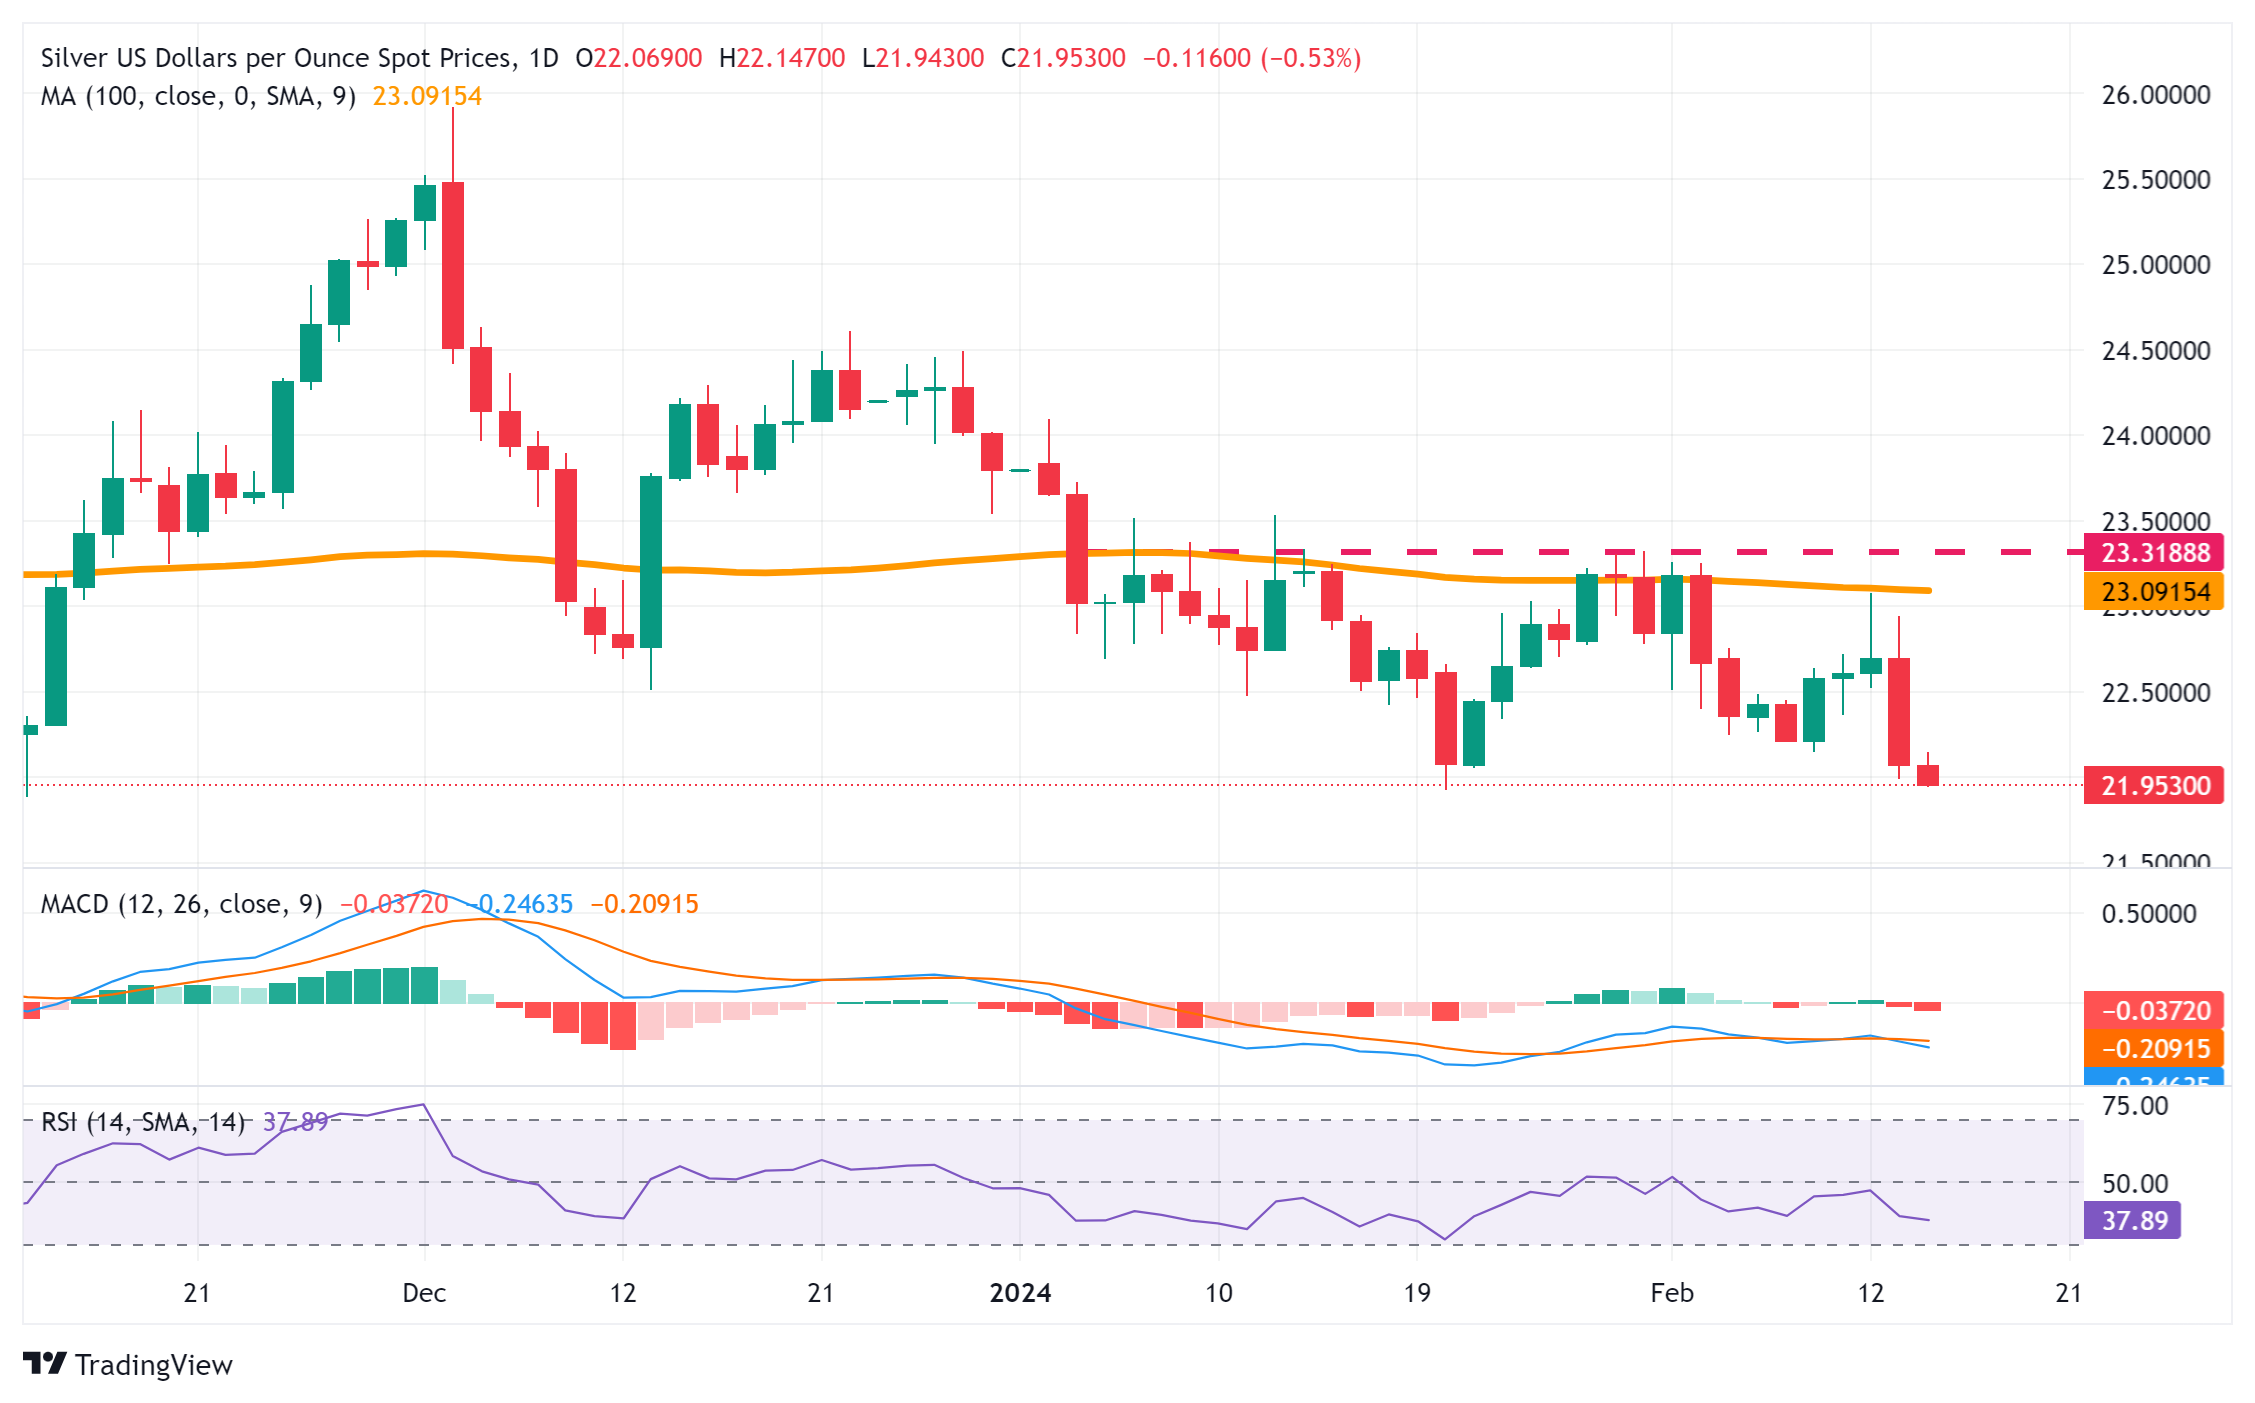
- Any recovery attempt could be slowed and is likely to remain capped near the $23.50 area.
The price of Silver (XAG/USD) remains under some selling pressure for the second day in a row and is approaching the yearly low during the first half of the European session on Wednesday. The white metal is currently trading below the round level of $22.00 and seems to be prolonging the depreciation movement.
From a technical standpoint, recent repeated failures near the all-important 200-day SMA and subsequent slide lower validate the negative near-term outlook for XAG/USD. Furthermore, the oscillators on the daily chart remain in negative territory and are still far from the oversold zone. This, in turn, suggests that the path of least resistance for the white metal remains to the downside.
Meanwhile, a drop below the two-month low reached in December will expose support at $21.40-$21.35. XAG/USD could weaken further below the $21.00 level and retest the October low near the $20.70-$20.65 area.
On the other hand, any significant recovery attempt could face strong resistance ahead of $22.00. However, sustained strength above that level could trigger a short covering rally and allow XAG/USD to reclaim the $23.00 level. Momentum could extend towards the 200-day SMA, currently around the $23.20 area. Below is the $23.50 resistance zone, which if broken decisively will nullify the negative outlook.
XAG/USD could then attempt to reclaim the round $24.00 level and continue rising towards the next relevant hurdle near the $24.50-$24.60 region en route towards the psychological $25.00 level.
Daily Silver Price Chart
Silver additional technical levels
Source: Fx Street
I am Joshua Winder, a senior-level journalist and editor at World Stock Market. I specialize in covering news related to the stock market and economic trends. With more than 8 years of experience in this field, I have become an expert in financial reporting.


