
- The recent ISM report noted a rebound in US business activity, and PMI indices beat expectations.
- Markets are pricing in a lower likelihood of a rate cut at the Fed's June meeting.
- The perception that the Fed is making hawkish bets has led to a spike in US Treasury yields, weighing on non-yielding metals.
- Investors are awaiting major U.S. labor market indicators for more information on the health of the economy.
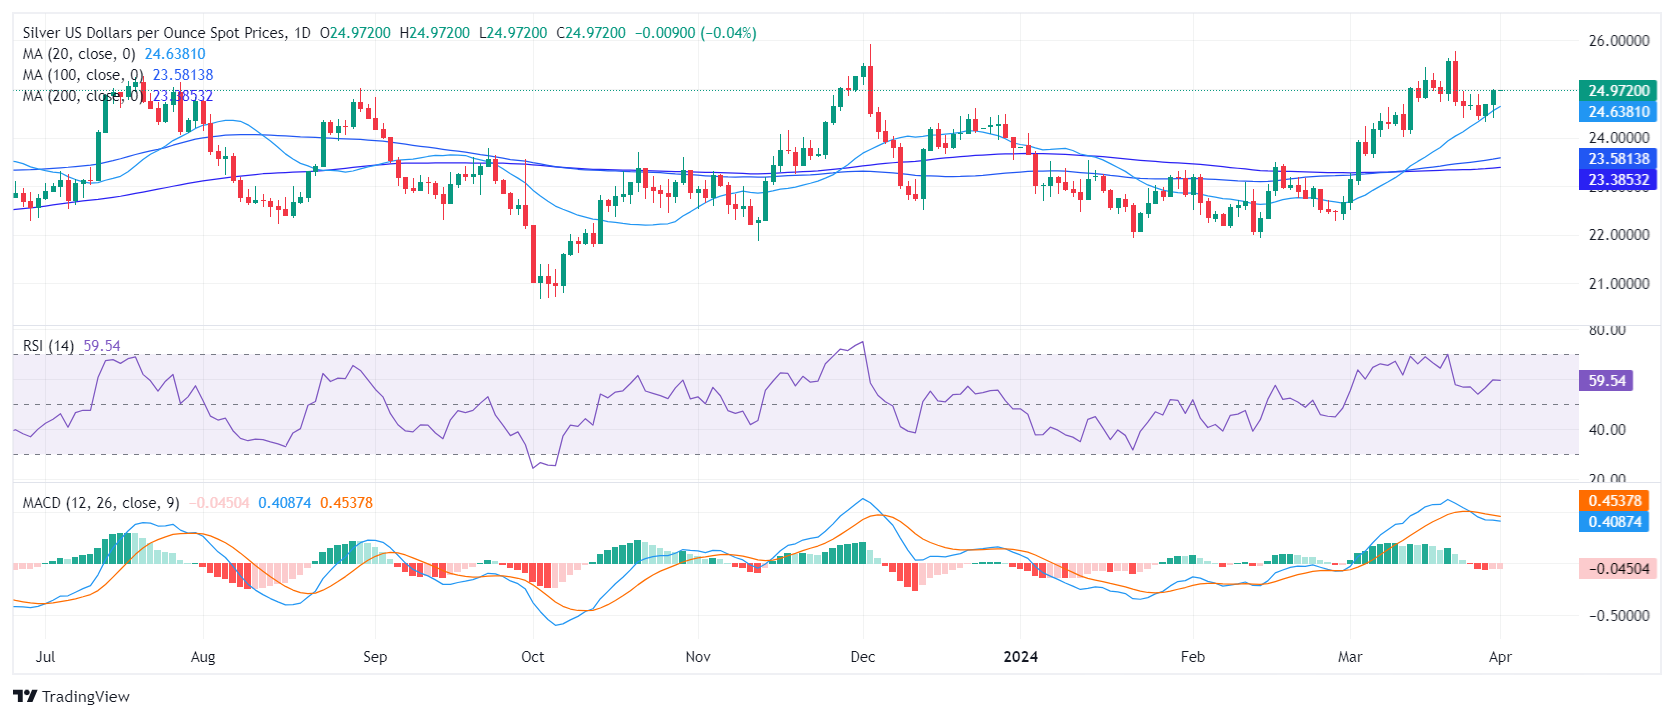
The pair XAG/USD trading near $24.98, mostly neutral during Monday's session. This follows signs of resilience in the US economy highlighted by the recent Institute for Supply Management (ISM) report and the surprising rebound in the manufacturing Purchasing Managers' Index (PMI). In this sense, the resilience of the US economy fueled an increase in hawkish bets on the Federal Reserve (Fed) alongside higher US Treasury yields that pushed back the gray metal.
Recent figures from the Institute for Supply Management (ISM) report have brought a breath of fresh air to the perception of the US economy, revealing a rebound in business activity in March. This is a sign of economic strength, echoed by the manufacturing Purchasing Managers' Index (PMI), which rose to 50.3 in March. This figure not only exceeded the forecast of 48.4, but was a notable advance compared to the 47.8 in February. For its part, the ISM prices paid index jumped to an annual high of 55.8, a level not seen since it stood at 52.5 in August 2022.
This pattern of improvement could lead the Federal Reserve (Fed) to think twice before relaxing its monetary policy. The market reaction has not been long in coming, and the probability of a rate cut at the Fed's June meeting has plummeted from 85% to around 65%, in response to the resilience that the US economy continues to show. . The fixed income market has also been affected by these developments, with a notable spike in US Treasury yields, often seen as the cost of holding non-yielding metals, with the 2-year yield rising at 4.71%, while both the 5-year and 10-year yields sit at 4.33%, all pointing to a strong rally and possibly reflecting the Fed's increasing hawkish bets.
Looking ahead, leading US labor market indicators such as Non-Farm Payrolls, Average Hourly Earnings and the Unemployment Rate are highly anticipated. These figures are set to provide a deeper look at the current health and trajectory of the country's workforce, offering critical clues to policymakers and investors alike.
XAG/USD technical analysis
On the daily chart, the Relative Strength Index (RSI) reveals a positive trend for XAG/USD. The RSI reading, nestled in the positive territory, remains firm asserting the dominance of the buyers, which may lead to continued bullish momentum. However, the moving average convergence divergence (MACD) is in negative territory, with red bars, suggesting a slight bearish presence.
Analyzing the overall trend,
Source: Fx Street
I am Joshua Winder, a senior-level journalist and editor at World Stock Market. I specialize in covering news related to the stock market and economic trends. With more than 8 years of experience in this field, I have become an expert in financial reporting.


”")

