
- The price of Silver consolidates around $27.60 as traders revalue Fed rate cut hopes.
- Persistent US inflation will fuel expectations that the Fed will delay rate cuts.
- Investors believe the Fed will hold interest rates next week.
The price of Silver (XAG/USD) remains in a tight range around $27.60 in the American session on Friday. Traders reassess expectations for Federal Reserve (Fed) rate cuts as the US underlying personal consumption expenditure (PCE) price index for March remains above consensus.
The annual core inflation figure rose 2.7%, compared to estimates of 2.6%, but slowed from the previous reading of 2.8%. On a month-on-month basis, price pressures grew in line with expectations and the previous reading of 0.3%. Maintaining upward pressure on prices fuels expectations that the Federal Reserve (Fed) will maintain a hawkish monetary policy framework.
The scenario is favorable for the US dollar and bond yields, but weighs on non-yielding assets, such as Silver. The US Dollar Index (DXY) bounces from 105.40 on expectations that the Fed will keep interest rates higher for longer. The Fed only considers it appropriate to cut rates when it has evidence that inflation will return to the desired rate of 2%. The 10-year US Treasury yield fell 1.15% to 4.65%.
Meanwhile, investors are focused on the Fed's interest rate decision, which will be announced on May 1. The Fed is expected to keep interest rates unchanged in the 5.25%-5.50% range. Although the Fed is expected to maintain the status quo, investors will focus on interest rate guidance.
Silver technical analysis
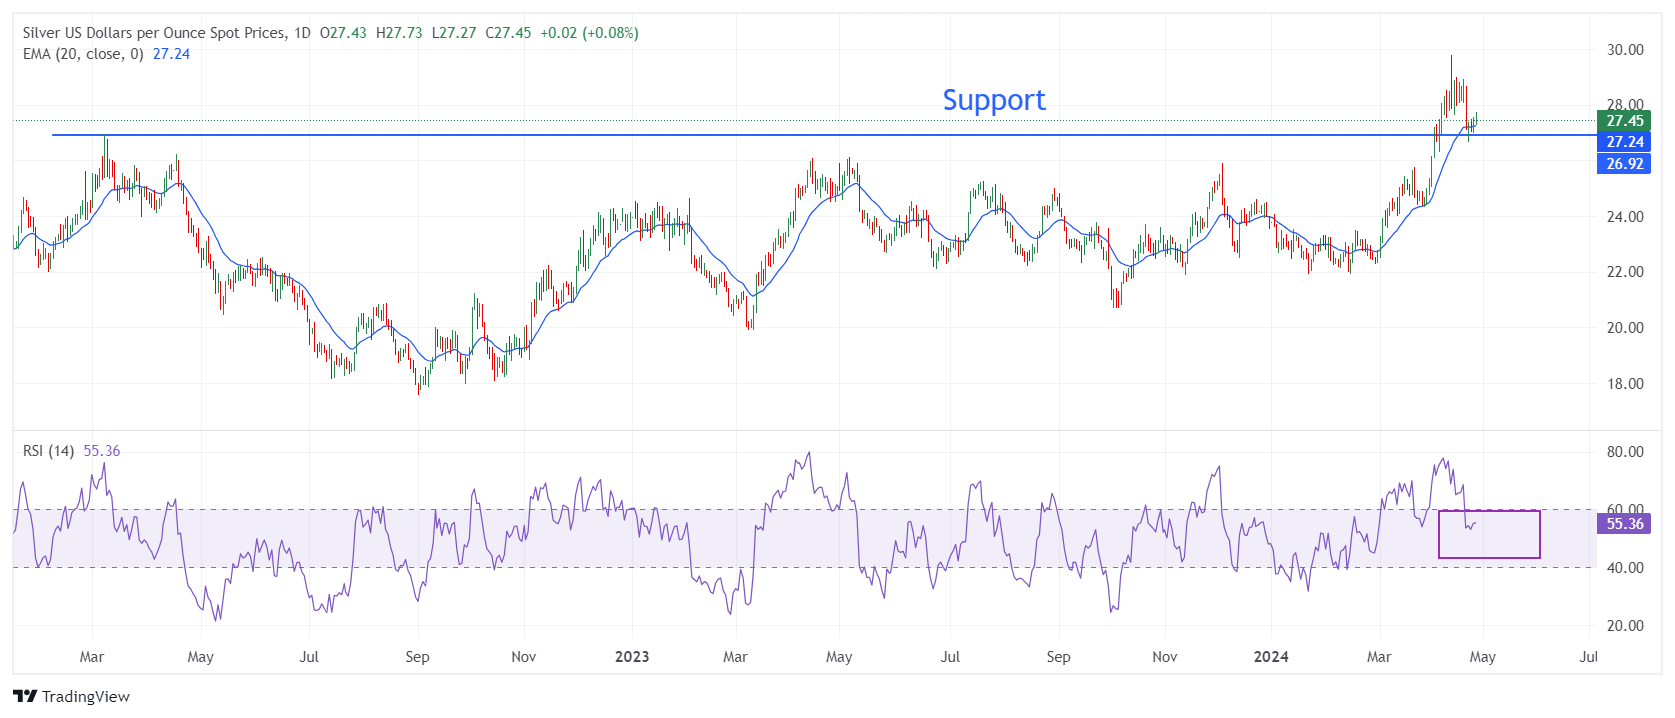
Silver price corrects near the March 2022 high near $27.00 after failing to extend the upside above the crucial resistance of $30.00. Silver's near-term appeal appears uncertain as it struggles to stay near the 20-day EMA, which is trading around $27.20.
The 14-period RSI is moving to the 40.00-60.00 range from the bullish 60.00-80.00 range, suggesting that the bullish momentum has moderated for now.
Silver Daily Chart
Source: Fx Street
I am Joshua Winder, a senior-level journalist and editor at World Stock Market. I specialize in covering news related to the stock market and economic trends. With more than 8 years of experience in this field, I have become an expert in financial reporting.


