
- Silver price sees some intraday selling on Tuesday, although lacks follow-through.
- The technical setup suggests that the path of least resistance remains to the downside.
- Recovery attempts could be seen as a selling opportunity and would remain limited.
The price of Silver (XAG/USD) is unable to build on the previous day’s modest recovery and attracts new sellers around the $23.20 area on Tuesday. The white metal continues its steady decline during the first part of the European session and hits a new daily low in the last hour, although it seems to find some support below the $23.00 level.
From a broader perspective, XAG/USD has been oscillating within a familiar range since last Thursday. Against the backdrop of the recent decline from the psychological level of $25.00, this range-bound price action could be classified as a bearish consolidation phase. Furthermore, the oscillators on the daily chart remain in negative territory and are still far from the oversold zone. This, in turn, suggests that the path of least resistance for XAG/USD is to the downside.
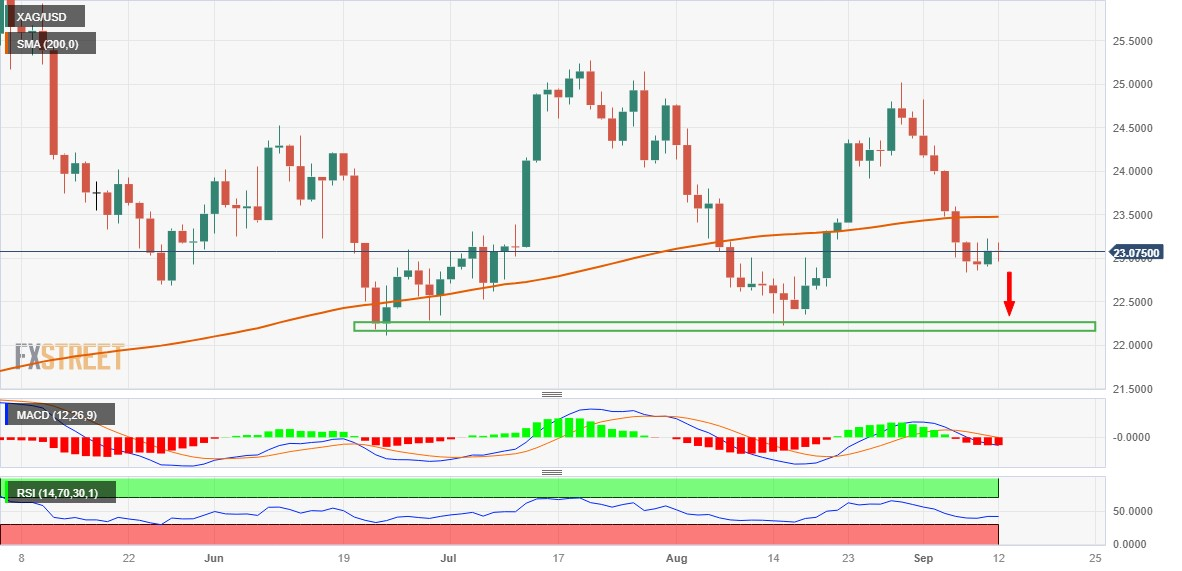
However, bears could wait for selling below the $22.85-$22.80 area or a multi-week low reached last Thursday, before opening new positions. Then, XAG/USD could accelerate the decline towards strong horizontal support near the $22.20-$22.10 zone. This area is followed by the $22.00 level, which if broken decisively will be a new trigger for the bears and will pave the way for the extension of a multi-week downtrend.
On the other hand, the $23.20 area seems to have become strong immediate resistance. Any further bullish movement could be seen as a selling opportunity and remain capped near the important 200-day SMA, currently near the $23.45-$23.50 area. This is followed by the 100-day SMA barrier, around the $23.80 region, and the $24.00 level, which if broken should nullify the near-term negative outlook for XAG/USD.
The subsequent short covering move has the potential to lift the white metal beyond the $24.30-$24.35 resistance zone, towards the recovery of the $25.00 psychological level. This last level represents the August high for XAG/USD and should act as a pivotal point. Sustained strength above this level will be seen as a new trigger for the bulls and pave the way for some significant bullish move for XAG/USD.
Silver Daily Chart
Silver additional technical levels
Source: Fx Street
I am Joshua Winder, a senior-level journalist and editor at World Stock Market. I specialize in covering news related to the stock market and economic trends. With more than 8 years of experience in this field, I have become an expert in financial reporting.


