
- The price of Silver suffers new selling pressure and reverses part of the previous day's gains.
- The technical situation favors the bears and supports the prospects for further losses.
- A sustained move above the $22.20-$22.25 confluence will negate the negative bias.
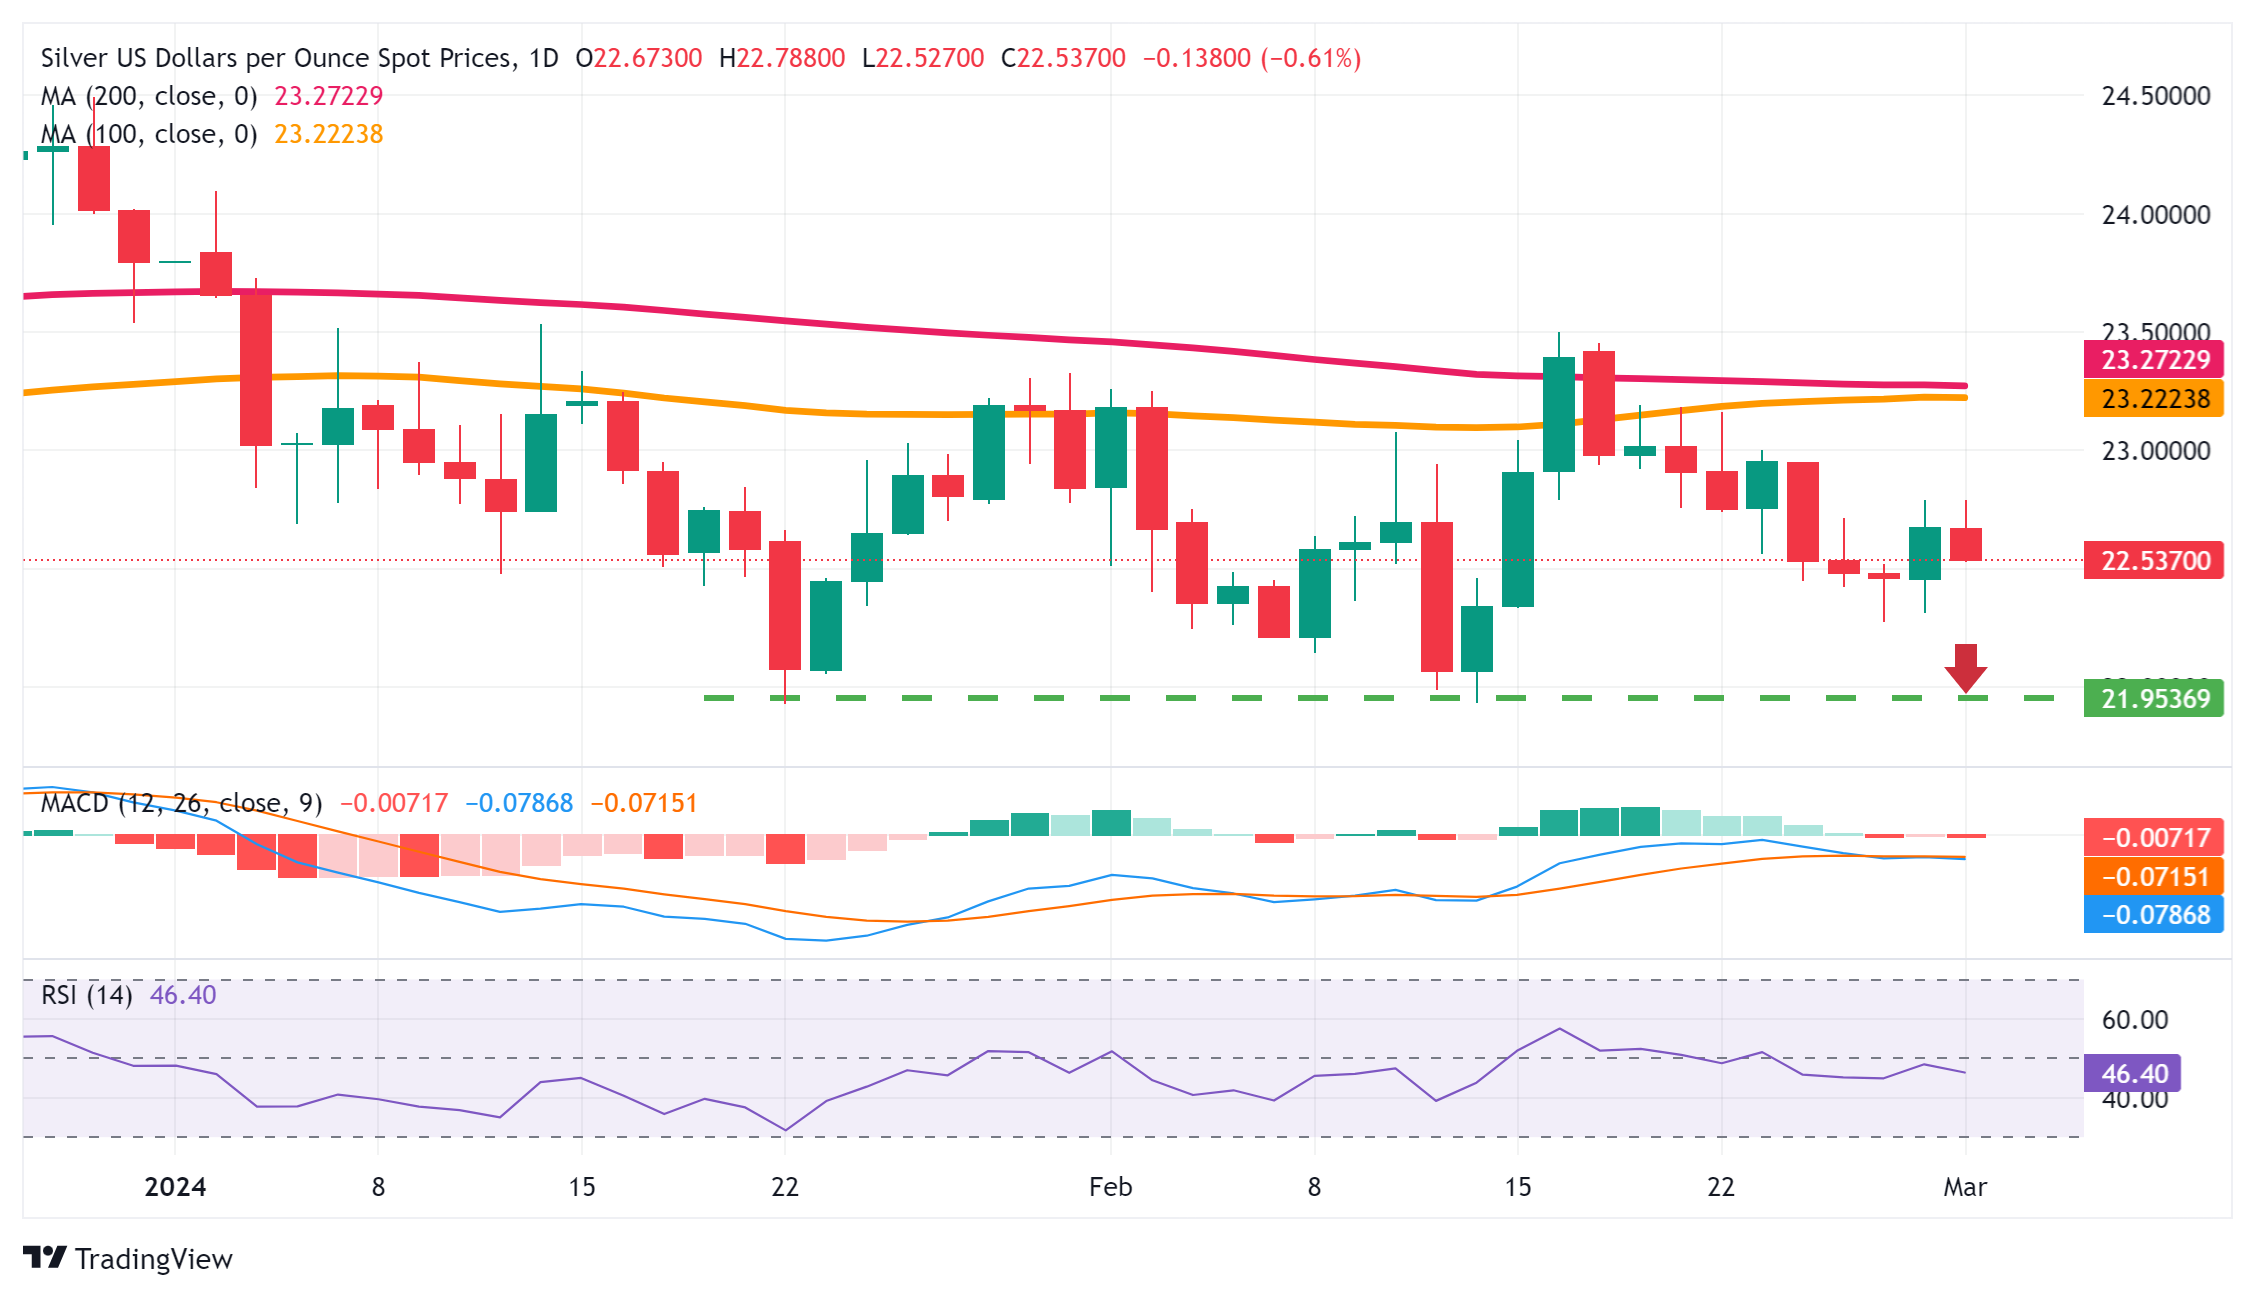
The price of Silver (XAG/USD) encounters some selling after an intraday rise to the $22.8 area on Friday and erodes a portion of the previous day's positive move to a multi-day high. The intraday decline continues during the first part of the European session and drags the white metal to a new daily low, approaching the $22.50 area again in the last hour.
From a broader perspective, the recent failure to find acceptance above the all-important 200-day SMA and subsequent decline favor the bears. Furthermore, the oscillators on the daily chart have just started to gain negative traction and suggest that the path of least resistance for XAG/USD is to the downside.
Therefore, a pullback towards a test of the weekly low, around the $22.30-$22.25 area, on the way to levels below $22.00, or the two-month low touched, seems a distinct possibility. in January. The bearish trajectory could extend further and eventually drag XAG/USD to the next relevant support near the $21.40-$21.35 area.
On the other hand, the daily high, around the $22.75-$22.80 area, could continue to act as an immediate obstacle before the round $23.00 level. Sustained strength beyond this latest level could trigger a short-covering rally, although it is likely to attract new sellers and remain capped near the $23.20-$22.25 confluence, which comprises the 100- and 200-day SMAs.
This is followed by the monthly high, around $23.50, which if broken decisively will nullify any negative short-term outlook and shift the bias in favor of the bulls. XAG/USD could then attempt to reclaim the $24.00 round level and continue rising towards the $24.3-$24.35 intermediate hurdle en route to the $24.50 resistance zone.
Daily Silver Price Chart
Source: Fx Street
I am Joshua Winder, a senior-level journalist and editor at World Stock Market. I specialize in covering news related to the stock market and economic trends. With more than 8 years of experience in this field, I have become an expert in financial reporting.


