
- XAG/USD is up nearly 0.50% near $22.90 after hitting a daily high of $23.70.
- The US manufacturing PMI fell to 46 in June, a worse-than-expected contraction.
- Falling US Treasury yields gave the precious metal room to rise.
Silver prices (XAG/USD) are rising, showing gains of approximately 0.70% and trading at $22.90, after a rally that led to a daily high of $23.70. This bullish momentum comes in response to June’s weak Purchasing Managers’ Index (PMI) for US manufacturing, which came in at a contractionary 46, below expectations. The decline in US Treasury yields has allowed the precious metal to rally, although it should be noted that yields remain in positive territory, which may limit the upside potential of XAG/USD.
The most recent release of the Institute for Supply Management (ISM) Manufacturing Purchasing Managers’ Index (PMI) for June revealed a reading of 46, below the 47.2 expected and the previous reading of 46.9.
Despite a broad pullback in US yields (which could be seen as the opportunity cost of holding silver), the hawkish Federal Reserve’s (Fed) expectations for July have remained firm. CME’s FedWatch tool indicates that a 25 basis point (bp) hike at the next meeting on July 31 is all but priced in, while the probability of another 25bp hike in 2023 has risen to around 40%. Additionally, market participants are eagerly awaiting the release of the Non-Farm Payrolls (NFP) data on Friday as it will continue to shape expectations about future Fed decisions.
That being said, it should be noted that rising interest rates tend to weaken precious metal prices, so traders should keep in mind that a hot NFP reading could trigger a further fall in XAG/USD.
XAG/USD Levels to Watch
According to the daily chart, the technical outlook for XAG/USD remains neutral with a bearish bias. The 20-day and 100-day SMAs are about to cross lower, while the indicators remain in negative territory.
If the metal continues to gain ground, resistance levels to watch are seen at the daily high around $23.05, followed by $23.10 and the aforementioned bearish cross at $23.30. Conversely, support levels are seen at the $22.80 level and below at the 200-day SMA at $23.55 and the $23.55 zone.
XAG/USD Daily Chart
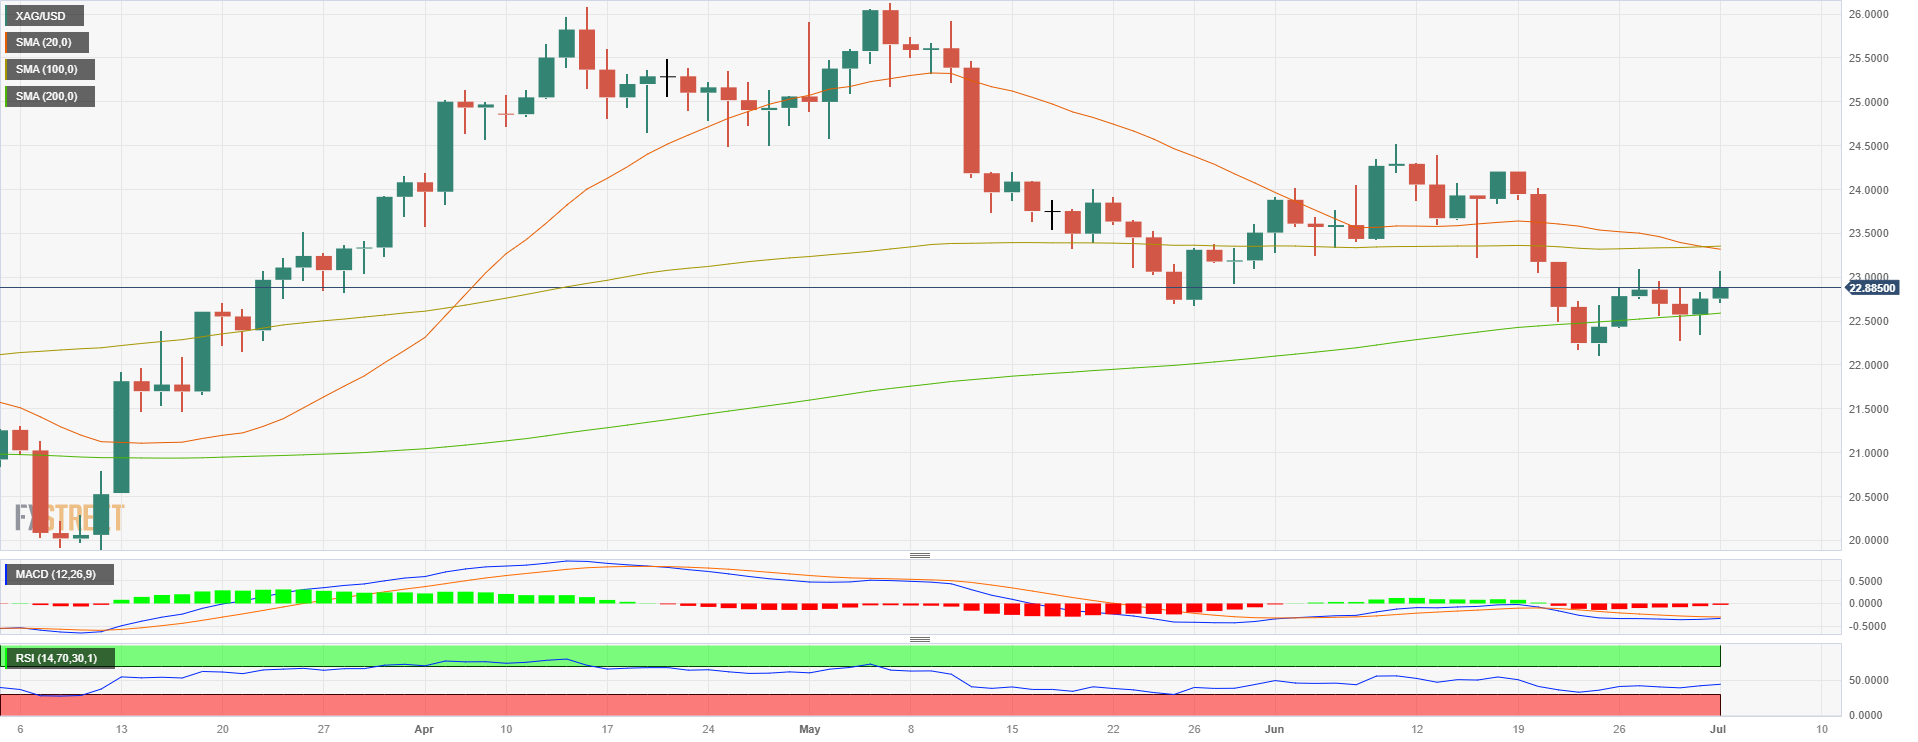
Source: Fx Street
I am Joshua Winder, a senior-level journalist and editor at World Stock Market. I specialize in covering news related to the stock market and economic trends. With more than 8 years of experience in this field, I have become an expert in financial reporting.


