
- Silver surpasses $25.50, while the US dollar stagnates.
- Investors remain risk averse as Fed rate cut expectations fade.
- The price of Silver aspires to recover the annual highs of $26.14.
The price of the Silver (XAG/USD) jumps to $25.80 after the US Bureau of Labor Statistics (BLS) reported stable JOLTS job opening numbers for February. US employers posted 8.756 million, compared to expectations of 8.74 million and the previous release of 8.748 million. This indicates that the demand for labor is stable.
Market sentiment is bearish as the S&P 500 has opened negative. The easing of Federal Reserve (Fed) rate cut expectations for the June meeting has made investors risk-averse. The 10-year US Treasury yield shoots up to 4.40%. The US Dollar Index (DXY) retreats to 104.70 after hitting a four-month high of 105.10.
The US dollar struggles to maintain its strength despite the upbeat US manufacturing PMI for March, which has further bolstered the US economic outlook. The Institute of Supply Management (ISM) reported that the manufacturing PMI was above the 50.0 threshold for the first time after 15 consecutive months of contraction.
This week, investors will focus on US Nonfarm Payrolls (NFP) data for March, due out on Friday. Labor market data will provide new clues as to when the Federal Reserve (Fed) will begin cutting interest rates.
Silver technical analysis
The price of Silver is just centimeters away from reaching the annual highs of $26.14, reached on May 5. Short-term demand for the white metal is bullish, as the 20-day EMA at $24.63 is sloping upwards.
The 14-period Relative Strength Index (RSI) is oscillating in the range of 60.00-80.00, indicating that the bullish momentum is intact.
Silver Daily Chart
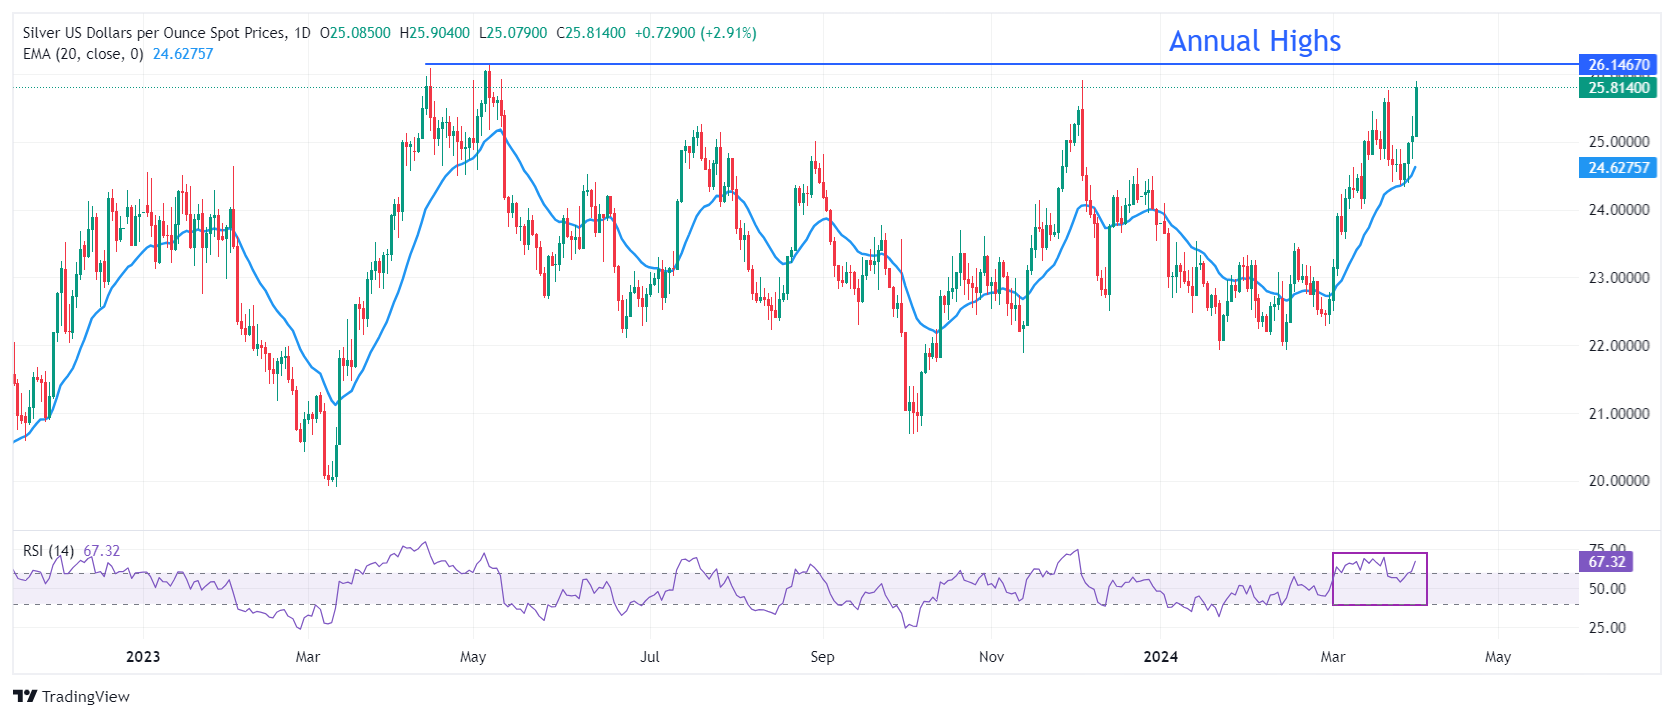
Source: Fx Street
I am Joshua Winder, a senior-level journalist and editor at World Stock Market. I specialize in covering news related to the stock market and economic trends. With more than 8 years of experience in this field, I have become an expert in financial reporting.


