
- The price of Silver is moving higher for the fifth day in a row and jumps to a near three-week high on Wednesday.
- A slightly overbought RSI on the hourly chart warrants some caution before opening new bullish positions.
- Any significant corrective dip could now be seen as a buying opportunity and remain limited.
Silver (XAG/USD) price extends its recent bounce from the $22.20 zone, the nearly two-month low hit last week, and gains strong continuation momentum for the fifth day in a row on Wednesday. This momentum lifts the white metal to a 2.5-week high during the European session, approaching the confluence barrier of $23.75.
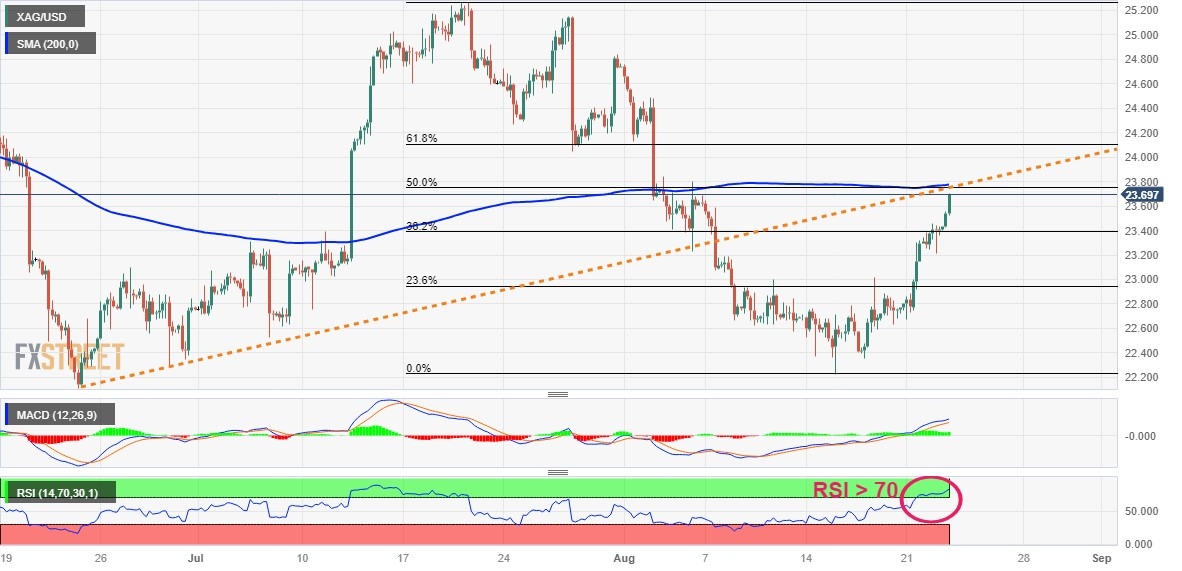
This zone comprises the 200 simple moving average (SMA) on the 4-hour chart, a support breakout of the rising trend line, and the 50% Fibonacci retracement of the July-August dip. A sustained strength above this level will be seen as a new trigger for bulls. However, the Relative Strength Index (RSI) on the hourly chart is showing overbought conditions, so it would be prudent to wait for intraday consolidation or a moderate pullback before positioning.
Technical indicators on the daily chart, however, have started to gain positive traction and suggest that the path of least resistance for XAG/USD is to the upside. Therefore, any significant decline could attract new buyers and remain capped near the $23.40 region, or the 38.2% Fibonacci. The next relevant support is near the $23.25 zone, below which a further round of technical selling could accelerate the decline and drag XAG/USD towards the 23.6% Fibonacci level around the $23.00 level.
Bulls, for their part, could expect a convincing breakout of the $23.75 confluence, above which XAG/USD could aim to recapture the $24.00 round level, which coincides with the 61.8% Fibonacci. The white metal could reach the next major hurdle near the $24.55-$24.60 zone, en route to the psychological $25.00 level and July high around the $25.25 zone.
Silver 4-hour chart
Silver additional technical levels
Source: Fx Street
I am Joshua Winder, a senior-level journalist and editor at World Stock Market. I specialize in covering news related to the stock market and economic trends. With more than 8 years of experience in this field, I have become an expert in financial reporting.


