
- Silver price rises near $34.50 as US JOLTS job openings data for September came in weaker than expected.
- The US Dollar gives up its intraday gains as weak job openings data points to a slowdown in labor demand.
- Investors will focus on a series of US economic data.
The price of silver (XAG/USD) finds strong buying interest in the North American session on Tuesday as the US Bureau of Labor Statistics (BLS) has reported a weak set of JOLTS job openings data for September. The white metal extends its recovery near $34.50 as weak job opening numbers have signaled a slowdown in the labor market.
Weak US job openings data has weighed on the US Dollar (USD), which has given back all of its intraday gains. The US Dollar Index (DXY), which tracks the value of the Dollar against six major currencies, retreats near 104.30 after refreshing a nearly three-month high around 104.60. US 10-year Treasury yields give up some of their intraday gains but hold key support at 4.20%.
US Dollar PRICE Today
The table below shows the percentage change of the US Dollar (USD) against major currencies today. US dollar was the strongest currency against the Australian dollar.
| USD | EUR | GBP | JPY | CAD | AUD | NZD | CHF | |
|---|---|---|---|---|---|---|---|---|
| USD | 0.07% | -0.20% | 0.06% | 0.08% | 0.33% | 0.23% | 0.25% | |
| EUR | -0.07% | -0.27% | -0.02% | 0.02% | 0.26% | 0.16% | 0.22% | |
| GBP | 0.20% | 0.27% | 0.28% | 0.29% | 0.53% | 0.43% | 0.48% | |
| JPY | -0.06% | 0.02% | -0.28% | 0.03% | 0.28% | 0.17% | 0.24% | |
| CAD | -0.08% | -0.02% | -0.29% | -0.03% | 0.24% | 0.15% | 0.20% | |
| AUD | -0.33% | -0.26% | -0.53% | -0.28% | -0.24% | -0.10% | -0.08% | |
| NZD | -0.23% | -0.16% | -0.43% | -0.17% | -0.15% | 0.10% | 0.03% | |
| CHF | -0.25% | -0.22% | -0.48% | -0.24% | -0.20% | 0.08% | -0.03% |
The heat map shows percentage changes for major currencies. The base currency is selected from the left column, while the quote currency is selected from the top row. For example, if you choose the US Dollar from the left column and move along the horizontal line to the Japanese Yen, the percentage change shown in the box will represent USD (base)/JPY (quote).
This week, investors will pay close attention to US third-quarter Gross Domestic Product (GDP) data, September Personal Consumption Expenditure (PCE) Price Index, Non-Farm Payrolls (NFP) and ISM Manufacturing PMI data for October released this week.
Economic data will indicate how the Federal Reserve’s (Fed) monetary policy will shape the rest of the year.
Meanwhile, the silver price outlook will remain firm amid uncertainty over the US presidential election on November 5. Traders expect former US President Donald Trump to return to power, while national polls have shown fierce competition with incumbent Vice President Kamala Harris. The risk profile has remained favorable for safe haven assets as Trump is expected to implement protectionist policies, which will result in an inflationary environment and have an adverse impact on the currencies of major US trading partners.
Silver technical analysis
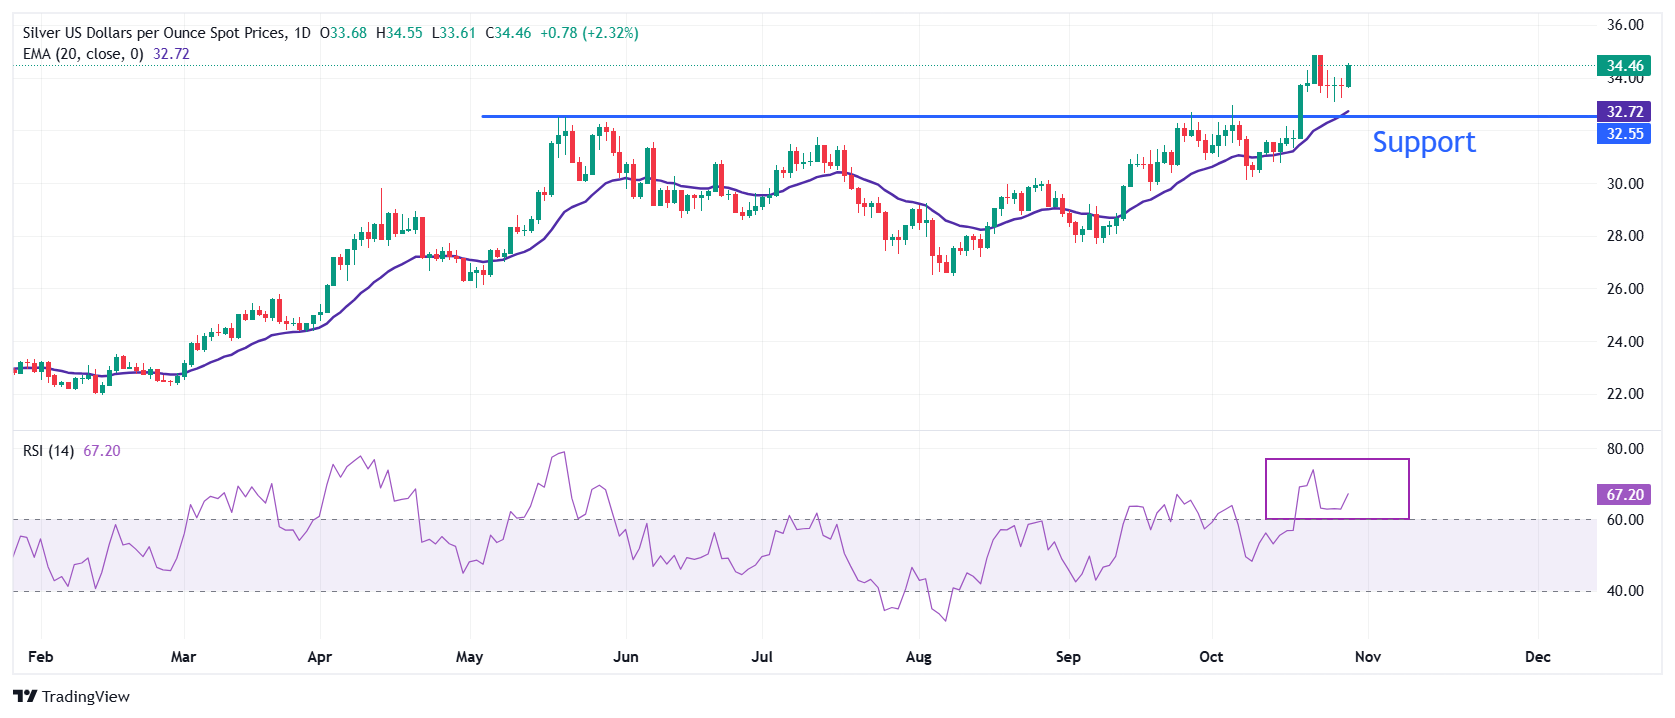
Silver price aims to reclaim a new more than 12-year high near $35.00 after a breakout of three days of consolidation. Horizontal support drawn from the May 21 high of $32.50, on a daily time frame, will act as a key cushion for silver price bulls from where it delivered a five-month consolidation breakout. The upward-sloping 20-day EMA near $32.70 signals more upside ahead.
The 14-day Relative Strength Index (RSI) remains in the range of 60.00-80.00, pointing to active bullish momentum.
Silver daily chart
economic indicator
Annualized Gross Domestic Product
The annualized GDP is published by the office Bureau of Economic Analysis and shows the value of goods, services and structures produced in a country in a period of one year. It is a crude measure of economic activity because it indicates the rate at which a country’s economy grows. A reading above expectations is bullish for the dollar, while a reading below is bearish.
Next post:
Wed Oct 30, 2024 12:30 (Prel)
Frequency:
Quarterly
Dear:
3%
Previous:
3%
Fountain:
US Bureau of Economic Analysis
The US Bureau of Economic Analysis (BEA) releases the Gross Domestic Product (GDP) growth on an annualized basis for each quarter. After publishing the first estimate, the BEA revises the data two more times, with the third release representing the final reading. Usually, the first estimate is the main market mover and a positive surprise is seen as a USD-positive development while a disappointing print is likely to weigh on the greenback. Market participants usually dismiss the second and third releases as they are generally not significant enough to meaningfully alter the growth picture.
Source: Fx Street
I am Joshua Winder, a senior-level journalist and editor at World Stock Market. I specialize in covering news related to the stock market and economic trends. With more than 8 years of experience in this field, I have become an expert in financial reporting.


