
- The price of Silver rises to $29, driven by demand for safe-haven assets due to geopolitical tensions.
- Falling yields in the US have reinforced demand for safe-haven assets.
- The US dollar advances as speculation about Fed rate cuts subsides.
The price of Silver (XAG/USD) appears poised for a positive weekly close for the third time in a row. The precious metal strengthens as geopolitical tensions and China's weak economic outlook bolster demand for safe-haven assets.
Iran has vowed to retaliate following the Israeli airstrike on its embassy near Damascus, which killed seven members of its Islamic Revolutionary Guard Corps (IRGC), including two generals. The war situation in Gaza between Israel and Palestine could worsen even further after the direct intervention of Iran. Meanwhile, the Israeli administration has vowed to invade Rafah, where displaced Palestinians have taken refuge. Investors are channeling their funds into safe-haven assets, such as Silver, amid geopolitical uncertainty.
Meanwhile, the sharp decline in US Treasury yields has reduced the opportunity cost of investing in non-yielding assets. US 10-year Treasury yields retreat to 4.55% from a more than four-month high of 4.60%. The US Dollar Index (DXY) is one step away from reclaiming its five-month high at 106.00 points.
The US dollar strengthens as persistent rise in consumer price inflation and strong non-farm payrolls (NFP) data for March have forced traders to unwind their bets on the Federal Reserve (Fed.) ) begin reducing interest rates at the June and July monetary policy meetings. Now, investors see the Fed making rate cuts starting in September. Additionally, investors expect the Federal Reserve to cut interest rates only twice between now and the end of the year, instead of the three predicted by Fed officials in the latest dot chart.
Silver technical analysis
Silver price is approaching an 11-month high near $30, drawn from the July 27, 2020 high on a weekly timeframe. The long-term outlook is bullish as the 20-week EMA at $24.56 is tilted higher. The 14-period Relative Strength Index (RSI) rises to 73.00, suggesting strong buying momentum. The absence of divergence signals favors the rises.
Silver Weekly Chart
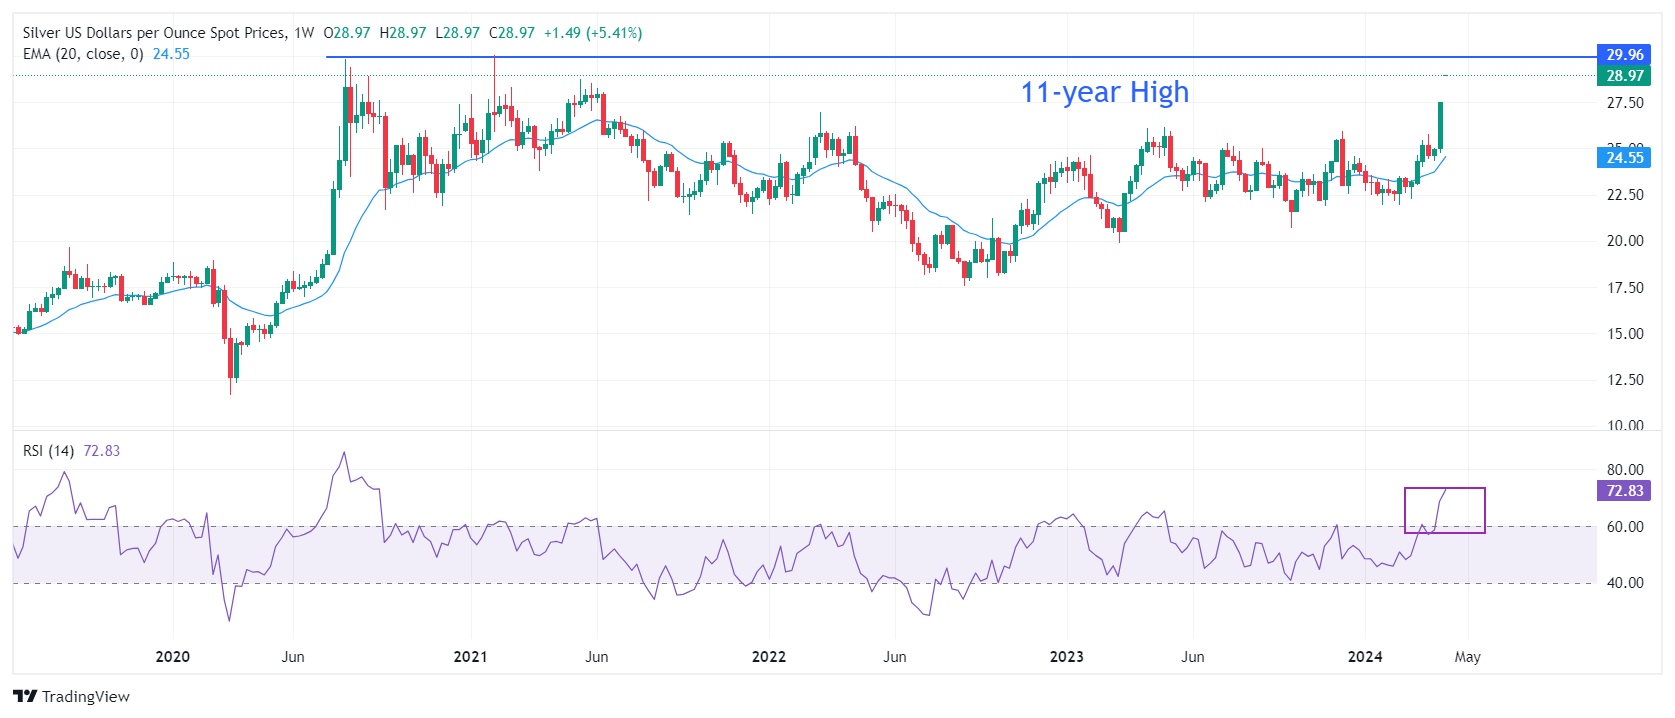
Source: Fx Street
I am Joshua Winder, a senior-level journalist and editor at World Stock Market. I specialize in covering news related to the stock market and economic trends. With more than 8 years of experience in this field, I have become an expert in financial reporting.


