
- Silver falls 1.60% to $31.67 as rising US yields reduce demand for the precious metal.
- The technical picture suggests a possible ‘double top’ formation, with the RSI pointing lower.
- Key support lies at $31.50, with potential targets at the September 30 low of $30.89 and the 100-day SMA at $29.74.
- A break above $32.00 could lead to a test of the yearly high of $32.95.
The price of Silver reversed course on Monday, falling more than 1.60% as rising US yields affected appetite for the precious metal, which failed to hold at $32.00 per troy ounce. At the time of writing, XAG/USD is trading at $31.67 after reaching a daily peak of $32.33.
Silver Price Analysis: Technical Perspective
The price of Silver remains inclined upwards, although it appears to form a ‘double top’ chart pattern, which could open the door to a reversal.
From a momentum point of view, the Relative Strength Index (RSI) is pointing down towards its neutral line, which could lead to further declines.
If XAG/USD falls below $31.50, sellers’ next target will be the September 30 cycle low of $30.89. Further weakness will push prices towards the 100-day SMA at $29.74, followed by the 50-day SMA at $29.49.
Conversely, if bulls push XAG/USD above $32.00, the yearly high could be tested at $32.95.
Silver Price Action – Daily Chart
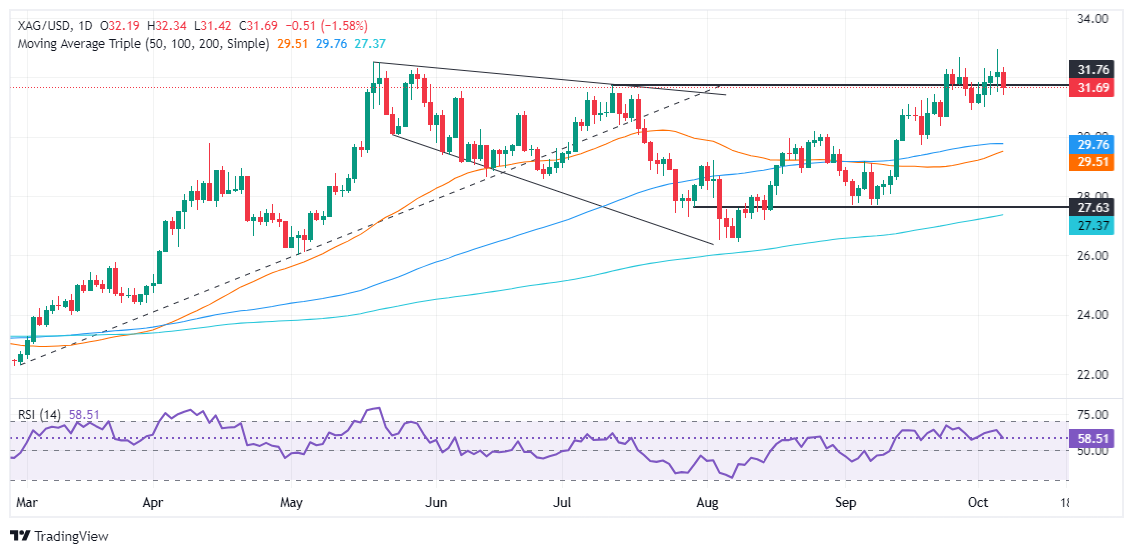
Source: Fx Street
I am Joshua Winder, a senior-level journalist and editor at World Stock Market. I specialize in covering news related to the stock market and economic trends. With more than 8 years of experience in this field, I have become an expert in financial reporting.


