
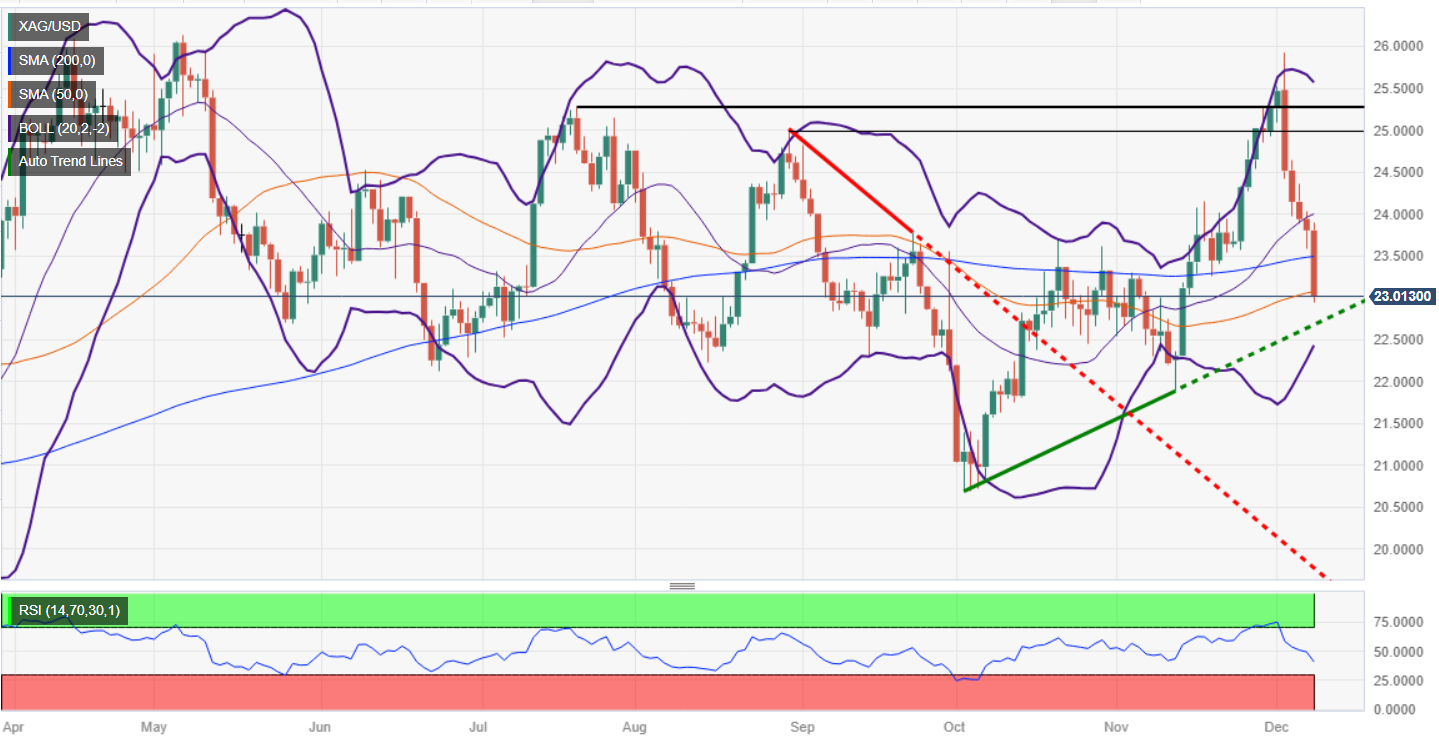
- XAG/USD confirms a bearish trend by breaking below the 200, 100 and 50-day moving averages.
- The bearish trend signals the possibility of testing the November 13 swing low at $21.88, unless buyers intervene to lift the pair.
- To the upside, buyers must reclaim $23.00 to challenge and overcome the broken DMAs, potentially targeting $24.00.
The price of the Silver is plunging more than 3% on the day, breaking key support levels on its way south, set to end the week with losses of more than 9.50%. At the time of writing, the XAG/USD pair is trading at $22.97 after reaching a daily high of $23.89.
The daily chart of That said, unless buyers lift the spot price, this would set the stage for a test of the November 13 swing low at $21.88.
First, XAG/USD sellers must drag prices below a supporting trend line passing around $22.69. Once broken, the next stop would be $22.00, ahead of the previously mentioned November 13 daily low.
Conversely, if Silver buyers reclaim the $23.00 level, that could pave the way for reclaiming each previously broken DMA. Once these levels are surpassed, the next signal would be $24.00.
XAG/USD Price Analysis – Daily Chart
XAG/USD Technical Levels
Source: Fx Street
I am Joshua Winder, a senior-level journalist and editor at World Stock Market. I specialize in covering news related to the stock market and economic trends. With more than 8 years of experience in this field, I have become an expert in financial reporting.


