
- Silver price rebounds from the 200-day SMA at $29.89, surpassing the $30 mark.
- A pincer formation is seen at the day’s high of $30.38, suggesting a possible pullback.
- Resistance and support are set at $30.40 and $28.78, respectively, with an eye on moves towards $31.00.
Silver price posts solid gains as it rebounds from the 200-day SMA of $29.89 and breaks the $30.00 threshold, up 0.43% at the time of writing. Although US economic data boosted the US dollar and kept US yields higher, the gray metal has extended its bullish trend.
Silver Price Analysis: Technical Perspective
From a technical perspective, silver buyers are struggling to stay above the $30.00 figure for the second day in a row. Although they reached a daily high of $30.38, a ‘tweezers’ candlestick pattern could pave the way for a pullback.
The Relative Strength Index (RSI) moved bullishly but remained around the neutral level of 50. This suggests that neither the buyers nor the sellers are in charge.
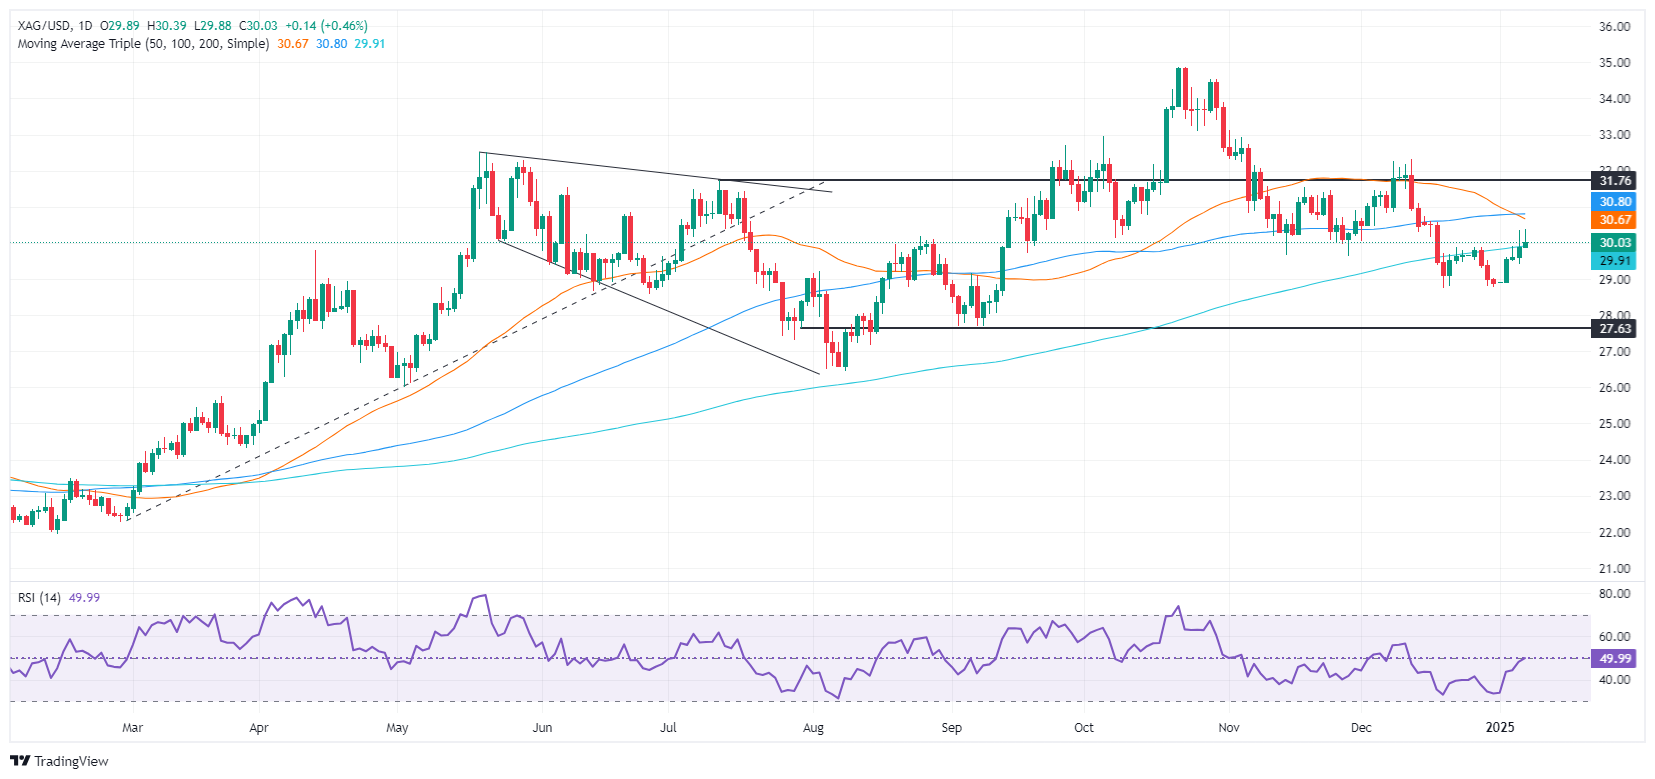
For a bullish continuation, XAG/USD must overcome the barrier of $30.40 per ounce. Once broken, the next key resistance level would be the 50-day SMA at $30.64, followed by the 100-day SMA at $30.78. With further strength, the $31.00 level would be exposed.
On the contrary, if XAG/USD falls below the 200-day SMA, sellers could push the price of the gray metal lower. Key support levels would be the December 31 low of $28.78, followed by the September 6 daily low of $27.69.
XAG/USD daily chart
Source: Fx Street
I am Joshua Winder, a senior-level journalist and editor at World Stock Market. I specialize in covering news related to the stock market and economic trends. With more than 8 years of experience in this field, I have become an expert in financial reporting.


