
- The price of Silver rises strongly to $22.70 due to the weakness of the US Dollar.
- The easing of geopolitical tensions has influenced the attractiveness of safe haven assets.
- The US core PCE price index data could postpone the Fed's plans to abandon its hawkish stance.
The price of Silver (XAG/USD) recovers strongly and approaches $22.70, while the US Dollar comes under pressure during the European session on Tuesday. The white metal rises as the US dollar faces selling due to easing geopolitical tensions.
US President Joe Biden hopes for a cessation of hostilities between Israel and Palestine next week. The US State Department stated that there has been progress in negotiations for the release of the Israeli hostages.
The DXY Dollar Index, which measures the strength of the Dollar against six rival currencies, extends its correction to 103.70.
This week, investors will focus on US January core Personal Consumption Expenditure (PCE) Price Index data, which will provide more information on the Federal Reserve's (Fed) rate cut schedule. Investors expect monthly core PCE to rise sharply to 0.4%, up from 0.2% in December. The annual core PCE reading is expected to slow to 2.8% from the previous reading of 2.9%.
Expectations of a rate cut by the Fed will be postponed if core inflation turns out to be higher than expected.
On Monday, Federal Reserve Bank of Kansas City President Jeffrey Schmid said inflation remains above 2%, tight labor market conditions and good demand prospects mean there is no need to rush to cut rates.
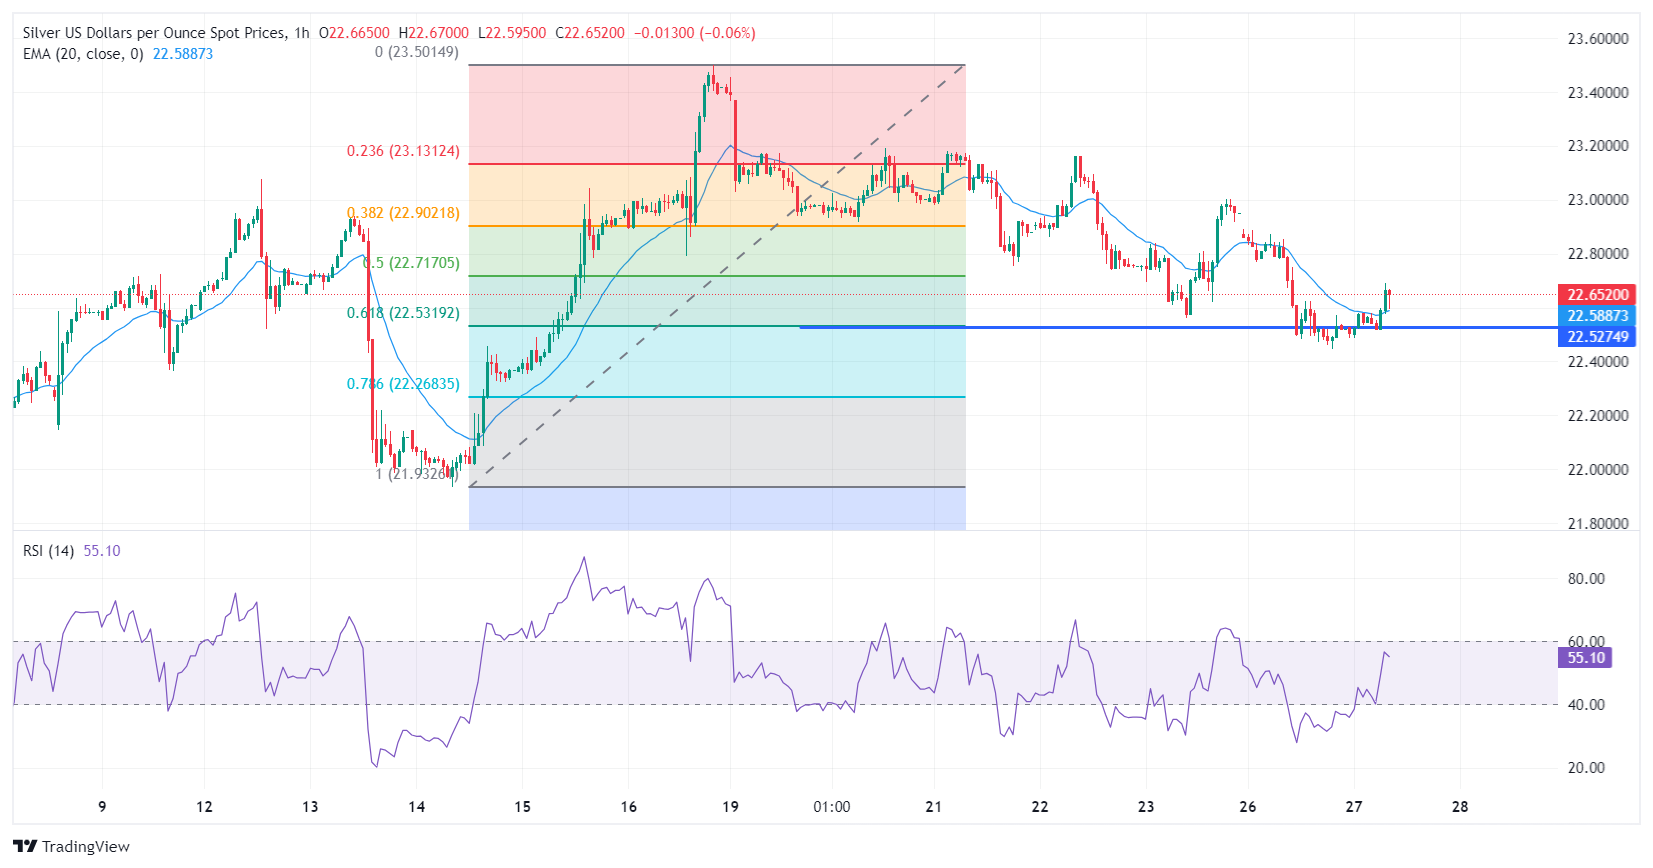
Technical analysis of the price of Silver
Silver price finds temporary support near the 61.8% Fibonacci retracement level (traced from the February 14 low of $21.93 to the February 16 high of $23.50) at $22.53. The white metal surpasses the 20-period exponential moving average (EMA), which is trading around $22.58.
The 14-period Relative Strength Index (RSI) is oscillating in the range of 40-60, indicating that consolidation is coming.
1 hour chart of the price of Silver
Source: Fx Street
I am Joshua Winder, a senior-level journalist and editor at World Stock Market. I specialize in covering news related to the stock market and economic trends. With more than 8 years of experience in this field, I have become an expert in financial reporting.


