
- Silver price remains sideways below $30.00 with focus on US ISM services PMI data.
- The US ADP reported that private payrolls were 152,000, missing estimates of 173,000.
- The Fed’s tight monetary policy framework is unfavorable amid normalizing labor market conditions.
The price of the Silver (XAG/USD) finds no direction and remains sideways below the psychological resistance of $30 even though the United States (US) Automatic Data Processing (ADP) has reported weaker than expected private payrolls data for May.
The agency reported that private employers recruited 152,000 jobs, below estimates of 173,000 and the previous figure of 188,000, revised downward from 192,000. This shows a normalization of labor market conditions, fueling expectations that the Federal Reserve (Fed) will reduce interest rates starting at the September meeting and weighing on the US dollar. The DXY Dollar Index, which tracks the value of the Dollar against six major currencies, faces pressure as it attempts to extend the recovery above 104.30.
US Dollar volatility is expected to remain high as investors await US ISM Services PMI data for May, due at 14:00 GMT. Economists have forecast that the services PMI is estimated to have returned to expansion, seen at 50.5, up from the previous figure of 49.4.
Apart from that, investors will also focus on other sub-components such as New Orders and Prices Paid Indices, which reflect the demand outlook and change in input prices. In the services sector, most spending goes on wages paid to workers, which has been a key factor in persistent price pressures.
Silver technical analysis
The price of silver is trading in an Ascending Channel chart pattern, formed on a daily time frame, in which each pullback is considered a buying opportunity by market participants. The upward-sloping 50-day and 200-day EMAs around $28.50 and $25.40, respectively, indicate that the overall trend is bullish.
The 14-period RSI falls back into the 40.00-60.00 range, suggesting that the bullish momentum has moderated. However, the bullish bias remains intact.
XAG Daily Chart
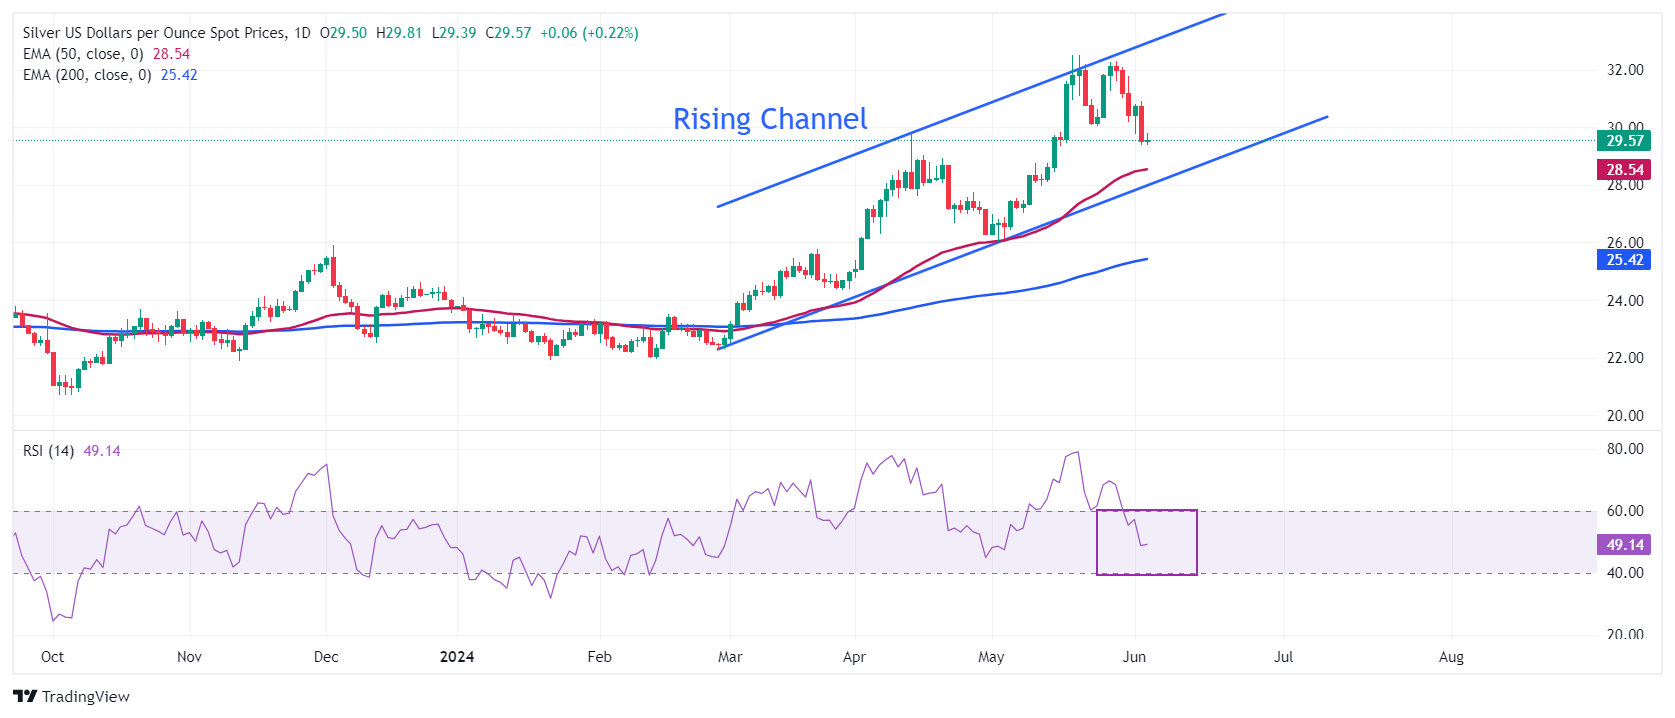
Source: Fx Street
I am Joshua Winder, a senior-level journalist and editor at World Stock Market. I specialize in covering news related to the stock market and economic trends. With more than 8 years of experience in this field, I have become an expert in financial reporting.


