
- Silver price reaches two-week highs on Friday, but fails to capitalize on it.
- The bulls now wait for a sustained move above the $24.00 level before opening any new positions.
- Weakness below the 100-day SMA is necessary to negate the short-term positive outlook.
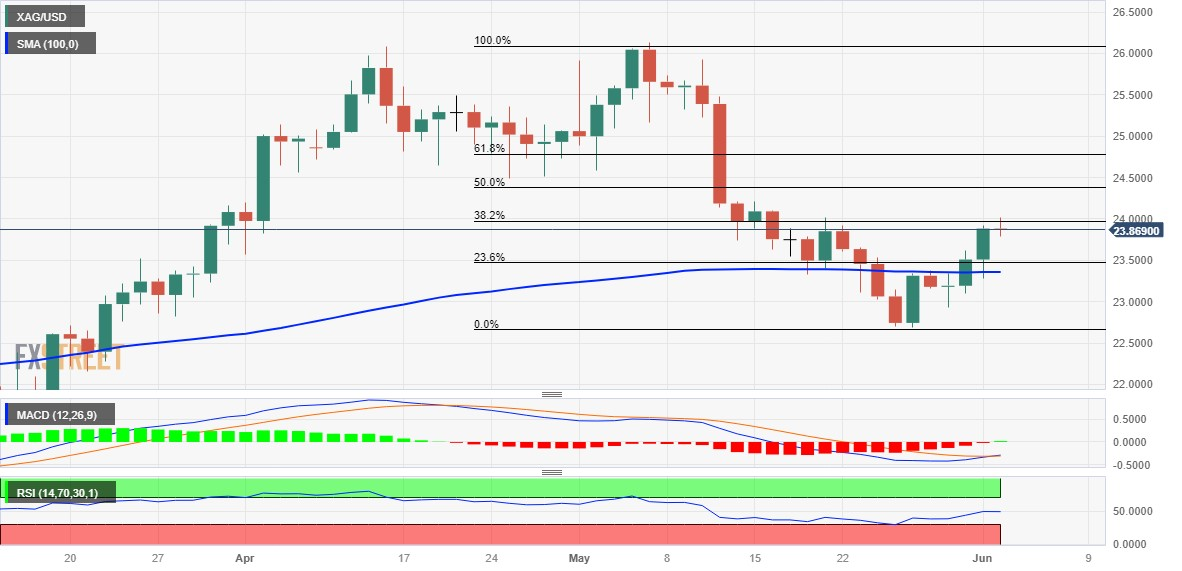
Silver (XAG/USD) extends its recent bounce from levels below $23.00 and hits a two-week high on Friday, though it is struggling to capitalize on the modest intra-day rise. The white metal pulls back from near the $24.00 level, where the 38.2% Fibonacci retracement of the May dip lies, and trades with a slight positive bias early in the European session.
From a technical standpoint, this week’s sustained move above the 100-day SMA and the previous day’s break of 23.6% Fibonacci favor the bulls. Furthermore, the oscillators on the daily chart have recovered from the negative zone, although they have not yet confirmed a positive outlook. Therefore, it is prudent to wait for buying above the $24.00 level before positioning for an extension of the recent bounce from the more than two-month low reached last week.
XAG/USD could then pick up momentum towards the next relevant hurdle near the $24.20-$24.25 region en route to the breakout of the $24.40-$24.50 horizontal support. The latter coincides with the 50% Fibonacci, above which a further short-covering move should allow the bulls to recapture the psychological $25.00 level. The bullish trajectory could extend towards the $25.30-$25.35 area before the white metal finally makes another attempt to conquer the $26.00 level.
On the other hand, any significant retracement seems to attract new buyers near $23.00, the 23.6% Fibonacci. This should help cap the fall in XAG/USD near the 100-day SMA, currently around the $23.35 zone. That being said, a convincing break below this region will expose the $23.00 level. This is followed by the monthly low for May, around the $22.70-$22.65 zone, which if broken decisively will nullify any positive outlook and turn the trend back in favor of the bears.
silver daily chart
Silver additional technical levels
Source: Fx Street
I am Joshua Winder, a senior-level journalist and editor at World Stock Market. I specialize in covering news related to the stock market and economic trends. With more than 8 years of experience in this field, I have become an expert in financial reporting.


