
- Silver price breaks below the psychological $21.00 level after failing to break above the 200 day EMA.
- The break of an ascending trend line compounded the decline from the daily highs around $21.60.
- XAG/USD Price Analysis: Break below $20.89 to pave the way towards $20.00.
Silver price falls below $21.00 late in the North American session amid risk aversion and US dollar (USD) recovery, as shown by the US Dollar Index (DXY), which gained 0.40% on day. At the time of writing, XAG/USD is trading at $20.95, losing almost 2% from its opening price.
Silver Price Analysis (XAG/USD): Technical Perspective
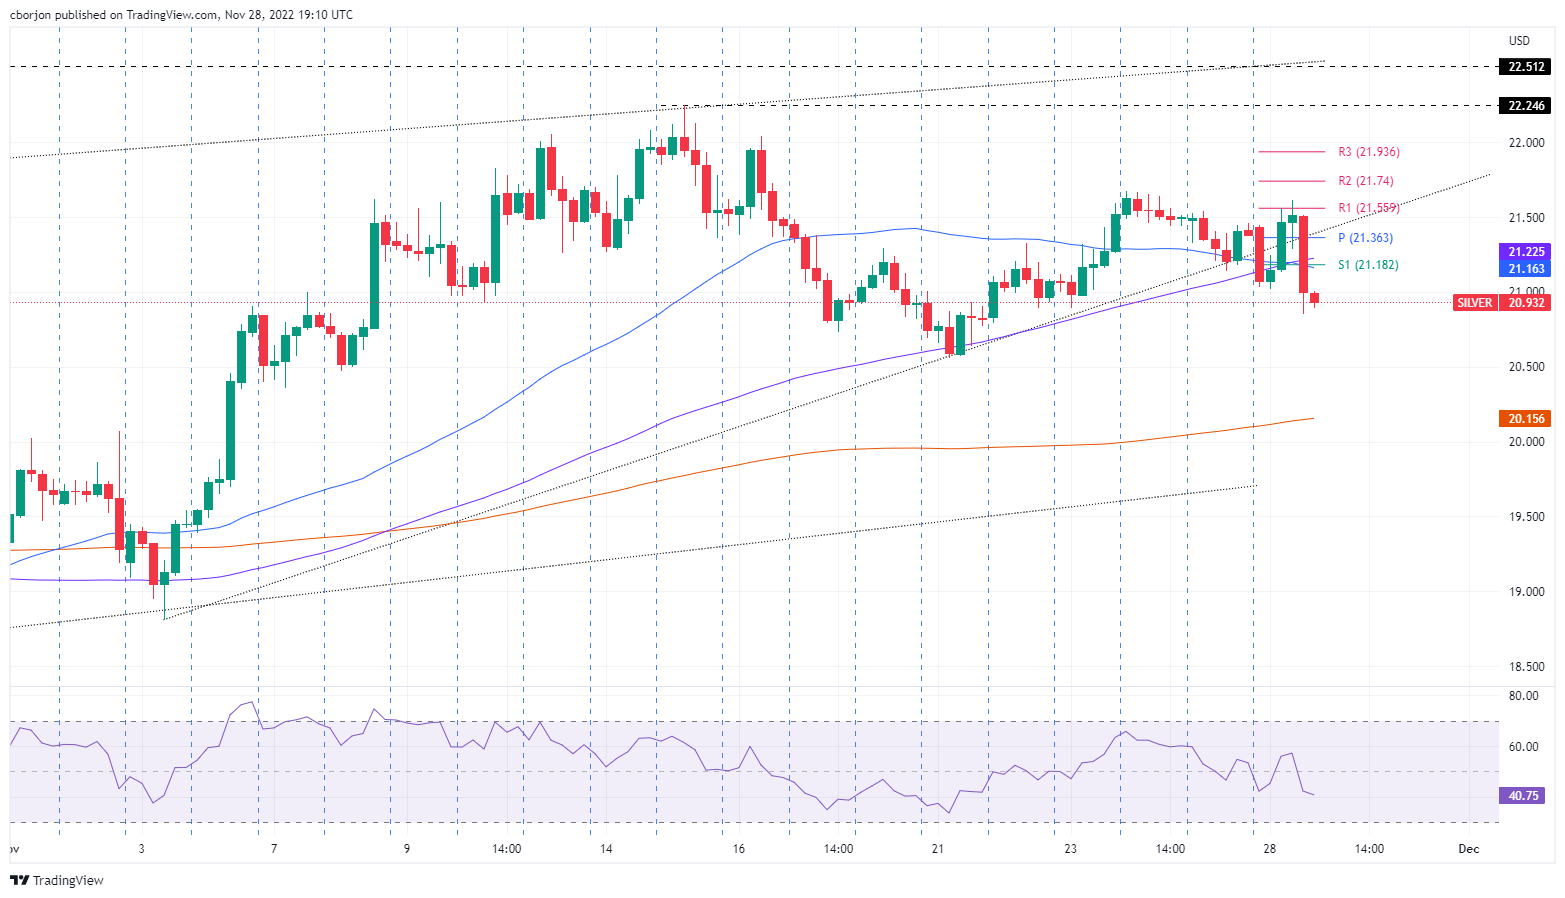
After the XAG/USD failed to break above the 200-day EMA at $21.34, the white metal is extending its losses below the $21.00 figure. Notably, Silver broke below a 20-day uptrend line, compounding Silver’s slide. The Relative Strength Index (RSI), which is targeting the 50 midline, is picking up, suggesting that the sellers are gathering momentum.
In the short term, the XAG/USD 4-hour chart shows the strength of the sellers. In particular, XAG/USD reached a daily high of around $21.61 before falling and recovering from the 50 and 100 EMAs. Therefore, the path of least resistance for XAG/USD leans to the downside. That being said, the first support for XAG/USD would be the November 23 swing low at $20.89. Once broken, the next support would be the November 21 pivot low at $20.56, followed by the 200 EMA at $20.15.
As an alternative scenario, the first resistance for XAG/USD would be the confluence of the S1 pivot and the 40 EMA at $21.16, followed by the daily pivot point at $21.36, before the R1 pivot at $21.55.
Key Silver Technical Levels
Source: Fx Street
I am Joshua Winder, a senior-level journalist and editor at World Stock Market. I specialize in covering news related to the stock market and economic trends. With more than 8 years of experience in this field, I have become an expert in financial reporting.


