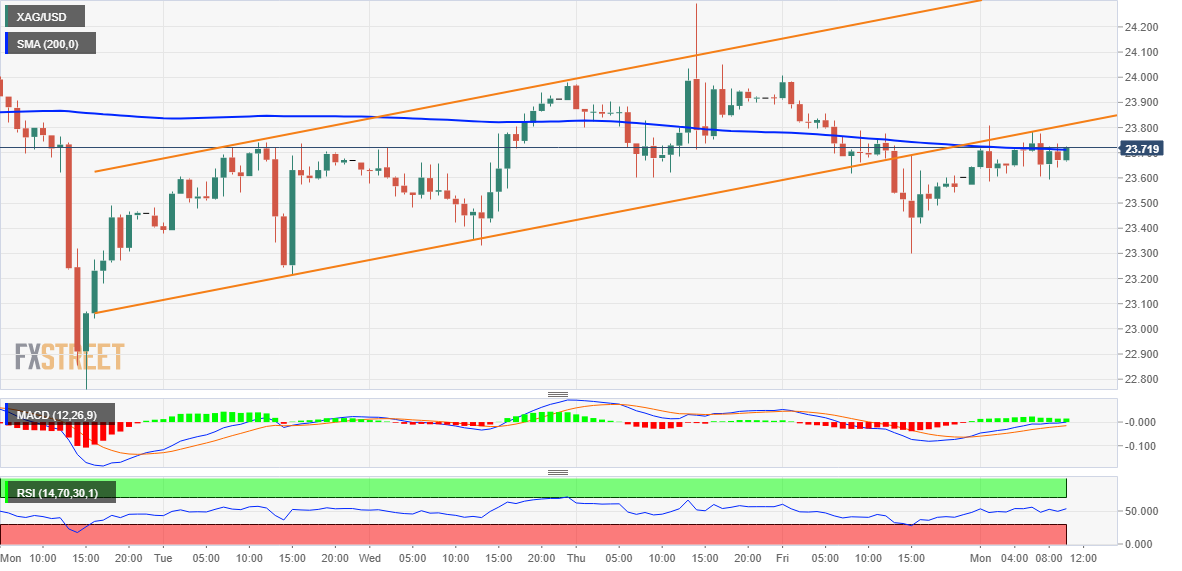
- Silver struggles to capitalize on a modest rally and fails near the breakout of $23.80 support.
- The mixed technical setup warrants some caution before making aggressive directional bets.
- A sustained move beyond the $24.50 zone is needed to negate any short-term negative outlook.
the silver is supported by Friday’s modest bounce from the $23.30 zone and gains some positive traction on the first day of a new week. However, the white metal fails to capitalize on its strength and remains capped near the breakout of the $23.70-$23.80 confluence support, which comprises the 200 hourly SMA and the lower end of a short-term rising channel. .
From a technical standpoint, last week’s break below the mentioned confluence support suggests that the near-term trend may have already turned in favor of the bears. That being said, the oscillators on the daily/hourly charts, although they have been losing momentum, still do not confirm the negative outlook. This, in turn, warrants some caution before positioning for any further depreciation moves.
Meanwhile, the low around $23.30 looks like immediate support. A convincing break below will leave XAG/USD vulnerable to weakening below the $23.00 signal and testing the next relevant support near the $22.75 zone. The bearish trajectory could eventually drag the white metal towards the intermediate support of $22.20-$22.15 on the way to the round figure of $22.00.
On the flip side, momentum beyond the support-turned-resistance at $23.70-$23.80 could face a hurdle near the $24.00 signal. This is followed by last week’s high, around the $24.30 region, and the $24.50-$24.55 supply zone, or a multi-month high hit on January 3rd. If it holds above, XAG/USD could retrace the psychological signal of $25.00 for the first time since April 2022.
Silver 1 hour chart

Key levels to watch
XAG/USD
| Overview | |
|---|---|
| Last price today | 23.7 |
| daily change today | 0.14 |
| today’s daily variation | 0.59 |
| today’s daily opening | 23.56 |
| Trends | |
|---|---|
| daily SMA20 | 23.77 |
| daily SMA50 | 23.21 |
| daily SMA100 | 21.49 |
| daily SMA200 | 21.01 |
| levels | |
|---|---|
| previous daily high | 24.01 |
| previous daily low | 23.3 |
| Previous Weekly High | 24.3 |
| previous weekly low | 22.76 |
| Previous Monthly High | 24.3 |
| Previous monthly minimum | 22.03 |
| Fibonacci daily 38.2 | 23.57 |
| Fibonacci 61.8% daily | 23.74 |
| Daily Pivot Point S1 | 23.24 |
| Daily Pivot Point S2 | 22.92 |
| Daily Pivot Point S3 | 22.53 |
| Daily Pivot Point R1 | 23.95 |
| Daily Pivot Point R2 | 24.33 |
| Daily Pivot Point R3 | 24.66 |
Source: Fx Street
I am Joshua Winder, a senior-level journalist and editor at World Stock Market. I specialize in covering news related to the stock market and economic trends. With more than 8 years of experience in this field, I have become an expert in financial reporting.


