
- Silver falls to $26.54, losing 0.43%; The “dragonfly doji” points to a possible bullish trend.
- Find support at the 61.8% Fibonacci level ($26.41); crossing $27.00 could boost bullish momentum.
- The downside risks if it falls below the May 2 low of $26.02, with the 50-day MA target at $25.79.
The upward trend in the price of Silver continued during the week despite registering losses of around 2.40%. However, the May 2 price action forming a “dragonfly doji,” a bullish candle, coupled with technical indicators suggesting the gray metal remains bullish, could pave the way for a recovery. At the time of writing, the XAG/USD pair is trading at $26.54, losing 0.43% on the day.
XAG/USD Price Analysis: Technical Outlook
As mentioned above, Silver maintains a bullish bias after posting an impressive rally above $29.00. It appears to have bottomed around the 61.8% Fibonacci retracement at $26.41, although buyers had failed to test the $27.00 mark.
Even though momentum has shifted to the downside, with the RSI below the 50 midline, upside risks remain. If buyers reclaim $27.00, it could reignite buying pressure and pave the way to challenge the next resistance level seen at the 38.2% Fibonacci retracement at $27.70. Once overcome, the next step would be the 23.6% retracement at $28.49.
However, with the RSI in bearish territory, sellers need to push prices below the May 2 low at $26.02. Once surpassed, the next stop would be the 50-day moving average (DMA) at $25.79, followed by the 78.6% Fibonacci retracement at $25.50.
XAU/USD Price Action – Daily Chart
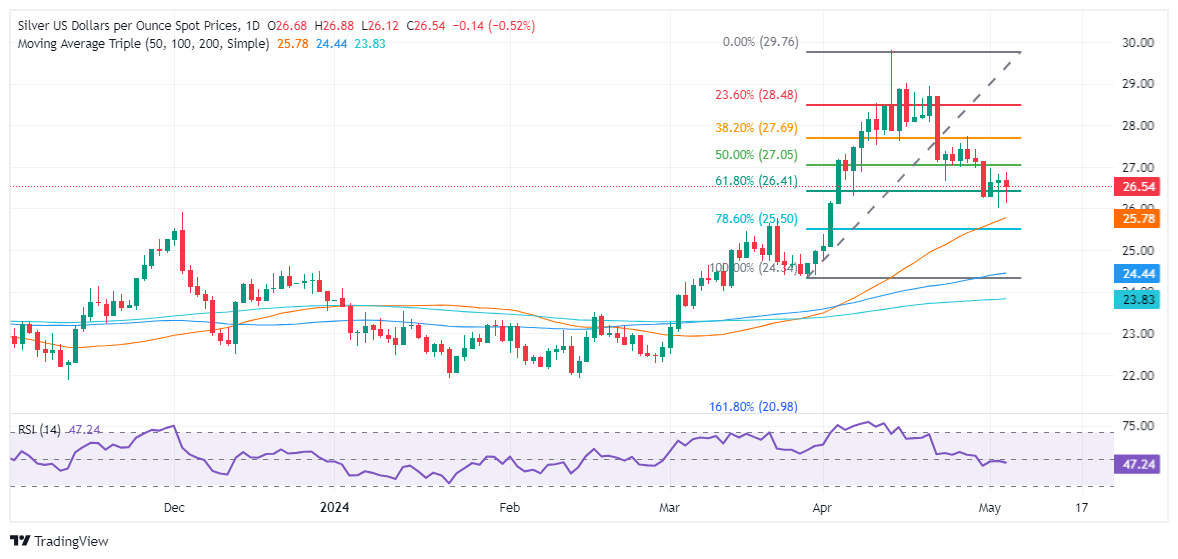
Source: Fx Street
I am Joshua Winder, a senior-level journalist and editor at World Stock Market. I specialize in covering news related to the stock market and economic trends. With more than 8 years of experience in this field, I have become an expert in financial reporting.


