
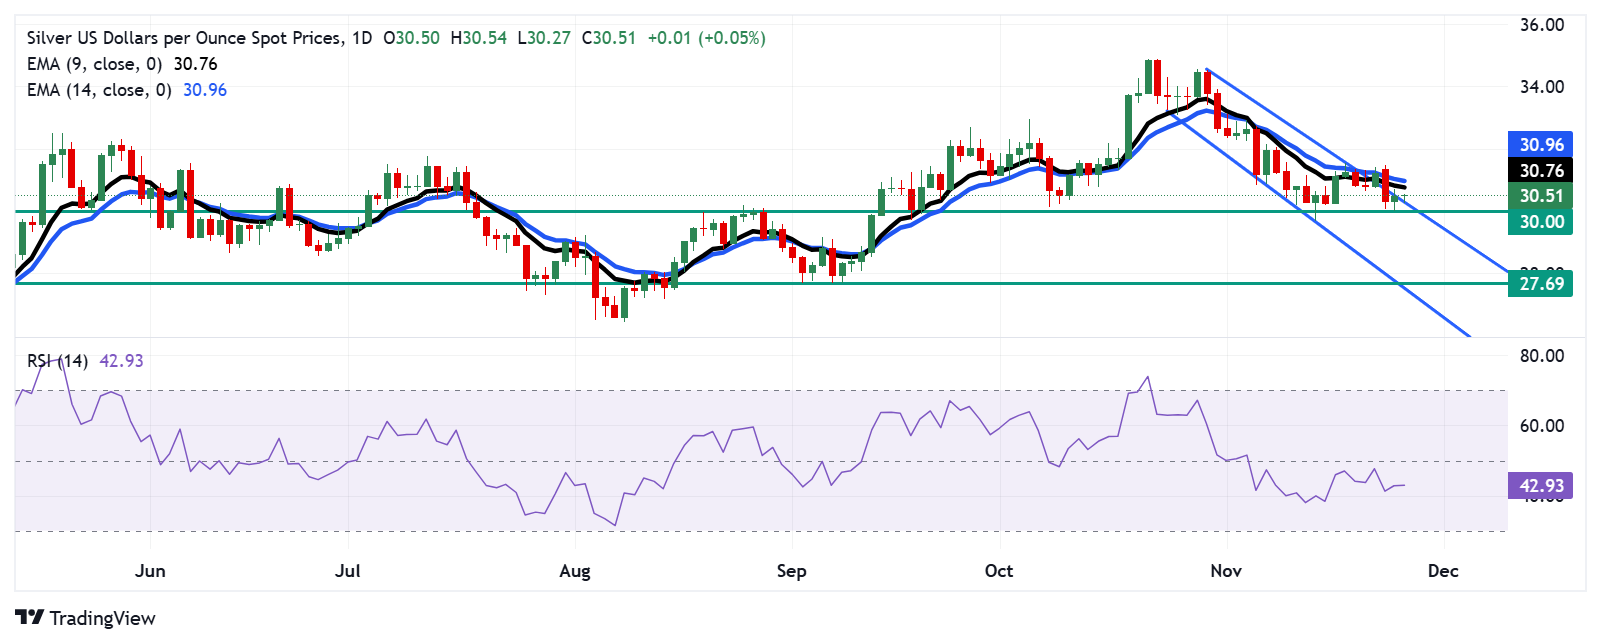
- Silver price appreciates as daily chart analysis suggests a possible momentum shift from bearish to bullish.
- The main resistance would be found at the nine-day EMA at $30.76.
- The pair could navigate the area around the retracement support at the $30.00 psychological level.
The price of silver (XAG/USD) remains stable near $30.50 per troy ounce during Asian hours on Wednesday. The daily chart analysis suggests a possible momentum shift from bearish to bullish as the pair has been following the upper line of the descending channel pattern.
However, the 14-day Relative Strength Index (RSI) is currently below the 50 level, indicating a prevailing bearish sentiment. Furthermore, the XAG/USD pair remains below the 14-day and nine-day EMA, signaling a bearish outlook and indicating weakening near-term price momentum. This suggests weak buying interest and the potential for further price losses.
In terms of upside, if silver price successfully breaks the key resistance zone near the upper boundary of the descending channel, the asset price would further test the nine-day Exponential Moving Average (EMA) at $30.76, followed by the 14 day EMA at $30.96.
To the downside, the silver price could find support around its “retracement support” at the psychological $30.00 level. A break below this level could deepen the bearish sentiment, potentially taking the price towards its three-month low of $27.69, followed by the lower boundary of the descending channel at $28.50.
XAG/USD: Daily Chart
Source: Fx Street
I am Joshua Winder, a senior-level journalist and editor at World Stock Market. I specialize in covering news related to the stock market and economic trends. With more than 8 years of experience in this field, I have become an expert in financial reporting.


