
- The silver price remains under some selling pressure for the second day in a row on Monday.
- The intraday break below the confluence of $23.55 supports the prospect of further losses.
- Sustained strength above the $24.00 level is needed to counter the negative outlook.
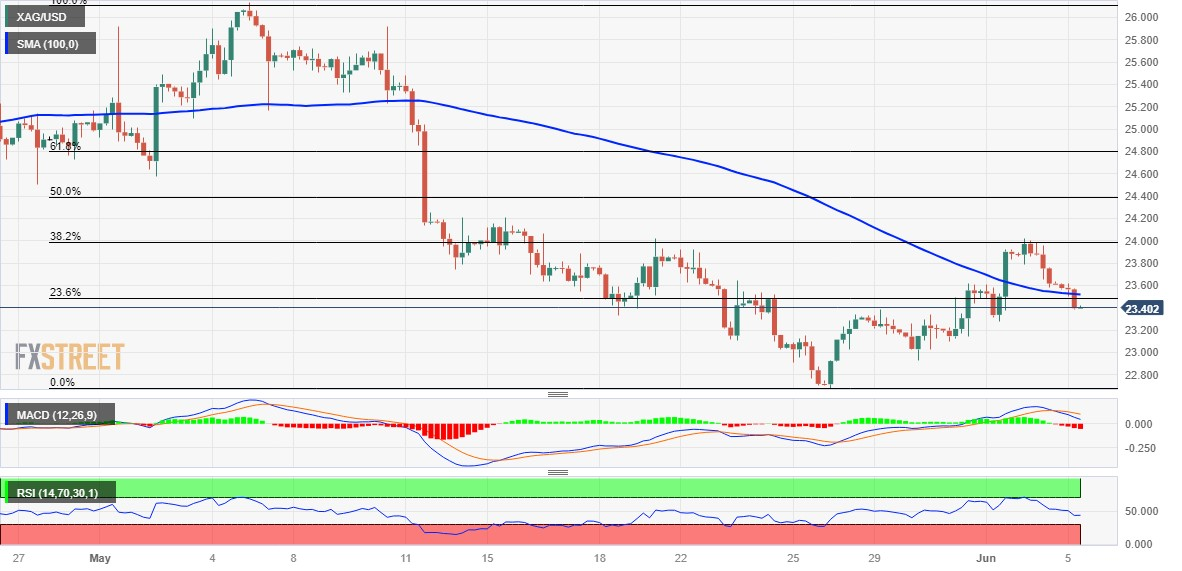
Silver (XAG/USD) price extends Friday’s rejection slide from the $24.00 level, or the 38.2% Fibonacci retracement of the decline witnessed in May, and declines for the second day in a row. The white metal holds its selling tone, just below the $23.50 level during the European session on Monday, and looks vulnerable to weakening further.
From a technical perspective, the intraday decline drags XAG/USD below the confluence support at $23.55, which comprises the 23.6% Fibonacci and the 4-hour 100 simple moving average (SMA). Furthermore, the bearish oscillators on the daily and 4-hour charts reinforce the negative outlook and support the prospects for a further intraday bearish move.
Therefore, a further slide, towards testing the $23.00 round level, looks like a clear possibility. A bit of continuation selling will expose the $22.70-$22.65 region, a two-month low hit in May, below which XAG/USD could eventually drop to the $22.00 level. This last zone represents the important 200-day SMA and should act as a turning point.
On the other hand, sustained strength above the breakout of the $23.55 confluence support could allow XAG/USD to make another attempt to conquer the $24.00 level. This is closely followed by horizontal resistance at $24.15-$24.20, above which momentum could push the commodity towards the 50% Fibonacci around the $24.45-$24.50 region.
Eventually, XAG/USD could rally to the $24.80 zone, or 61.8% Fibonacci, and try to recapture the psychological $25.00 level for the first time since May 11. The upside trajectory could extend further towards the $25.30-$25.35 resistance zone en route to the $26.00 round level and a 1-year high around the $26.10-$26.15 area hit in May.
Silver 4 hour chart
Silver additional technical levels
Source: Fx Street
I am Joshua Winder, a senior-level journalist and editor at World Stock Market. I specialize in covering news related to the stock market and economic trends. With more than 8 years of experience in this field, I have become an expert in financial reporting.


