
- The price of Silver is struggling to take advantage of Friday's rebound from around $22.00.
- Neutral oscillators on the daily chart warrant some caution before opening directional positions.
- Sustained strength above the 200-day SMA will shift the bias in favor of the bulls.
The price of Silver (XAG/USD) meets fresh selling on the first day of a new week and gives back a significant portion of Friday's recovery gains from more than a one-week low. The white metal maintains its selling tone around the $22.85-$22.80 area during the first half of the European session and appears vulnerable to prolonging its recent decline witnessed over the last week or so.
From a technical standpoint, the recent failure to find acceptance above the important and significant 200-day SMA and subsequent decline validate the negative near-term outlook for XAG/USD. That said, the oscillators on the daily chart are not yet confirming a bearish trend, so it is prudent to wait for some follow-through selling to occur before positioning for any further short-term depreciation moves.
Meanwhile, Friday's low around $22.00 could continue to protect the immediate decline ahead of horizontal support at $22.30. The next relevant support is near the $21.90-$21.85 area, or the two-month low reached in January. A convincing break below this last level will be seen as a new trigger for the bears and has the potential to drag XAG/USD towards the test of the $21.40-$21.35 support zone.
On the opposite side, the round $23.00 level seems to have emerged as an immediate hurdle, which if cleared could trigger a short-covering rally and lift XAG/USD to the 200-day SMA, currently near the $23.30. Below is the monthly high, around $23.50. Sustained strength beyond this last level will negate the negative outlook and allow XAG/USD to once again aim to reclaim the round $24.00 level.
The momentum could extend towards the $24.50-$24.60 zone, above which the white metal could reach the psychological level of $25.00.
Daily Silver Price Chart
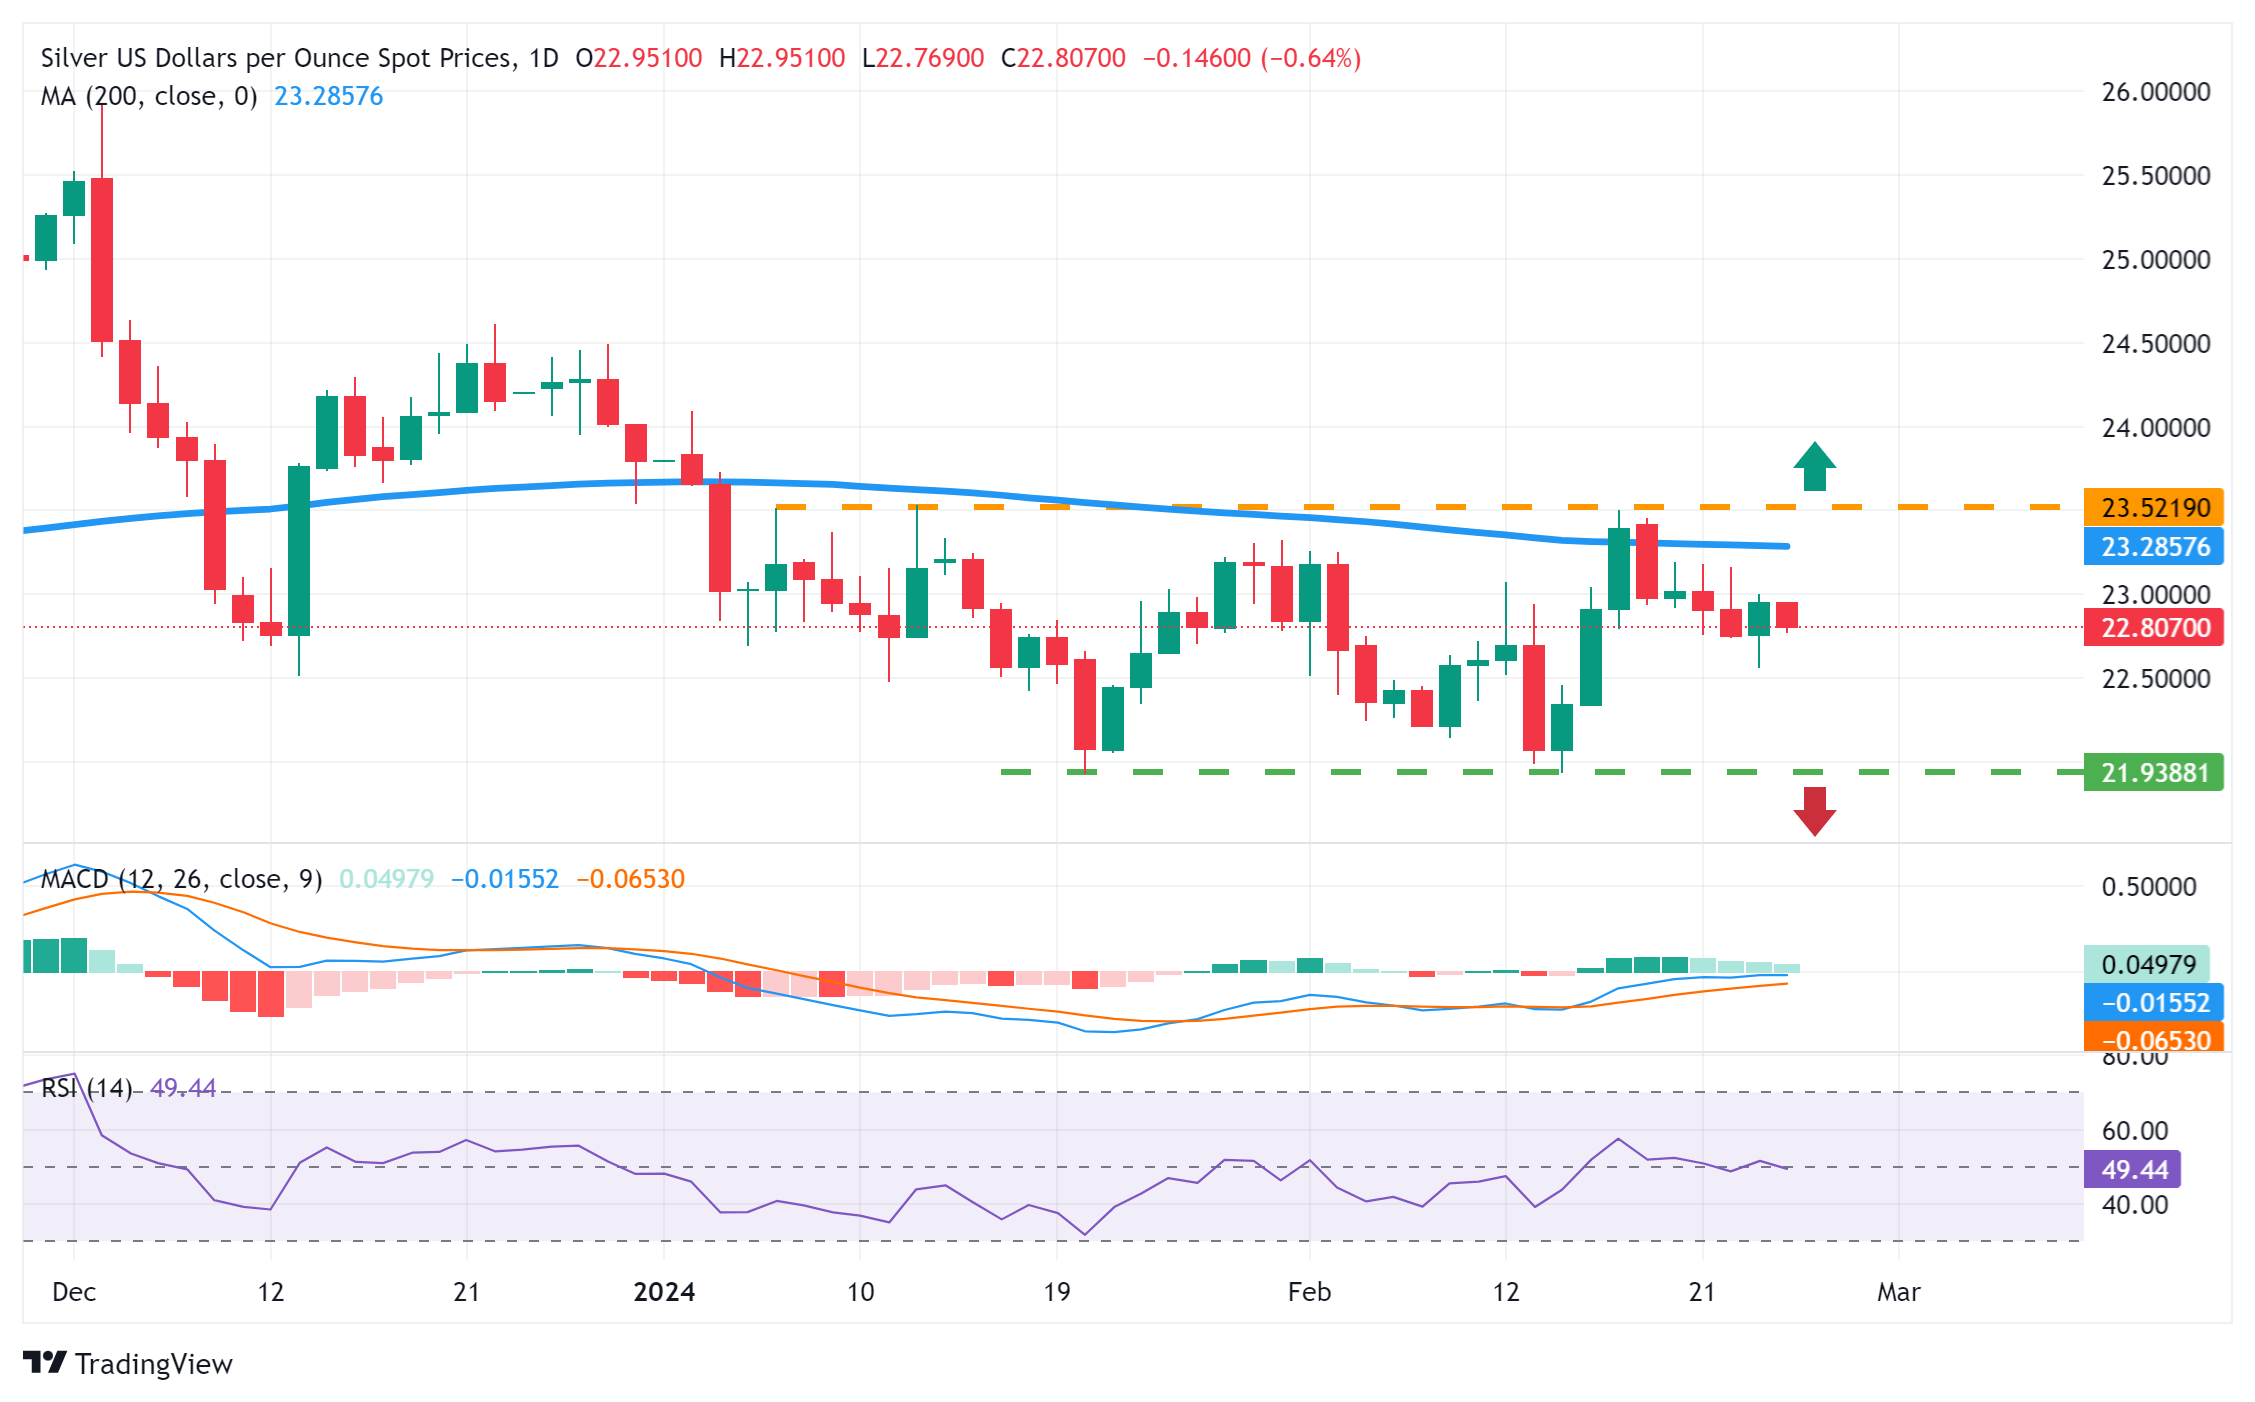
Source: Fx Street
I am Joshua Winder, a senior-level journalist and editor at World Stock Market. I specialize in covering news related to the stock market and economic trends. With more than 8 years of experience in this field, I have become an expert in financial reporting.


