
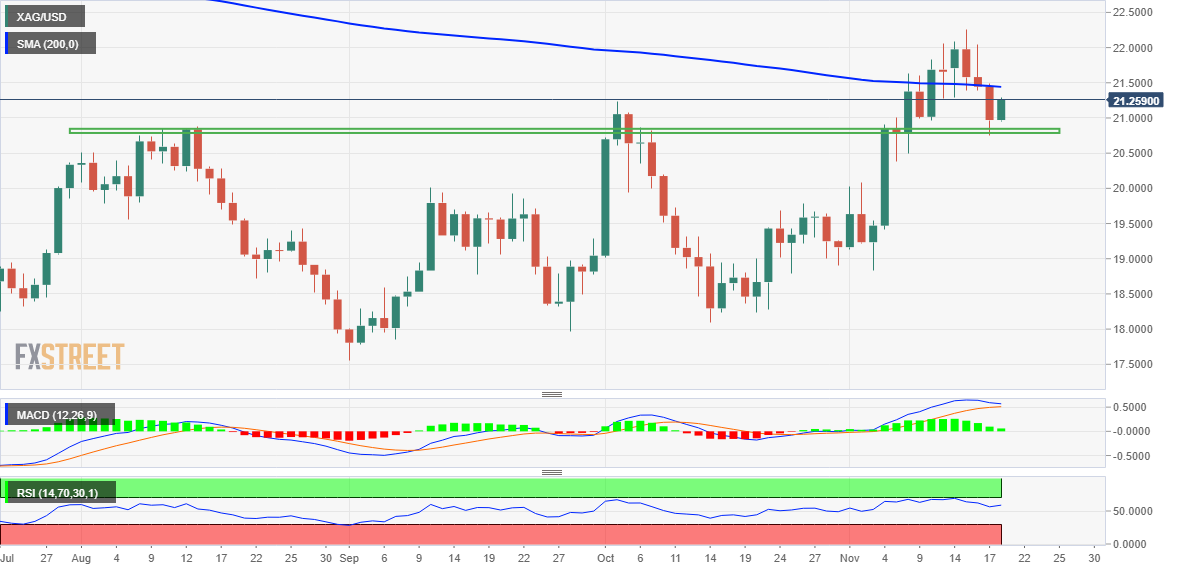
- Silver is making a good rebound from the one-week low hit on Thursday.
- The previous day’s drop and close below the 200-day SMA favor the bears.
- Any further move higher could face stiff resistance near the $21.70 area.
Silver (XAGUSD) regains some positive traction on Friday and recoups some of the previous day’s heavy losses to hit a 1.5-week low. The white metal is holding on to its intraday gains around the $21.20 to $21.25 region during the first half of the European session and appears to have broken a three-day losing streak for now.
From a technical point of view, sustained weakness from the previous day and a decisive close below the key 200-day SMA favor the bears. The breakout point for that support is currently around the $21.40 zone and should act as a benchmark for intraday traders. Sustained strength above this level has the potential to push the XAGUSD towards the $21.70 horizontal barrier.
Momentum could extend further towards the $22.00 level, which is followed by the multi-month high around the $22.25 area touched on Tuesday. Continuation buying will be seen as a new trigger for bulls and set the stage for further gains. XAGUSD could then test the $22.50 to $22.60 area and eventually recapture the round $23.00 level.
On the other hand, the low around $20.75 seems to protect the immediate fall before the support of $20.40 at $20.35. The next relevant support is near the psychological level of $20.00. Failure to defend this last level will negate any near-term positive bias and leave XAGUSD vulnerable to an extension of the downside.
silver daily chart
silver key levels
Source: Fx Street
I am Joshua Winder, a senior-level journalist and editor at World Stock Market. I specialize in covering news related to the stock market and economic trends. With more than 8 years of experience in this field, I have become an expert in financial reporting.


