
- The silver market falls to a 1-week low on Thursday, but finds support above the $21.00 level.
- The mixed technical setup warrants some caution before opening aggressive directional positions.
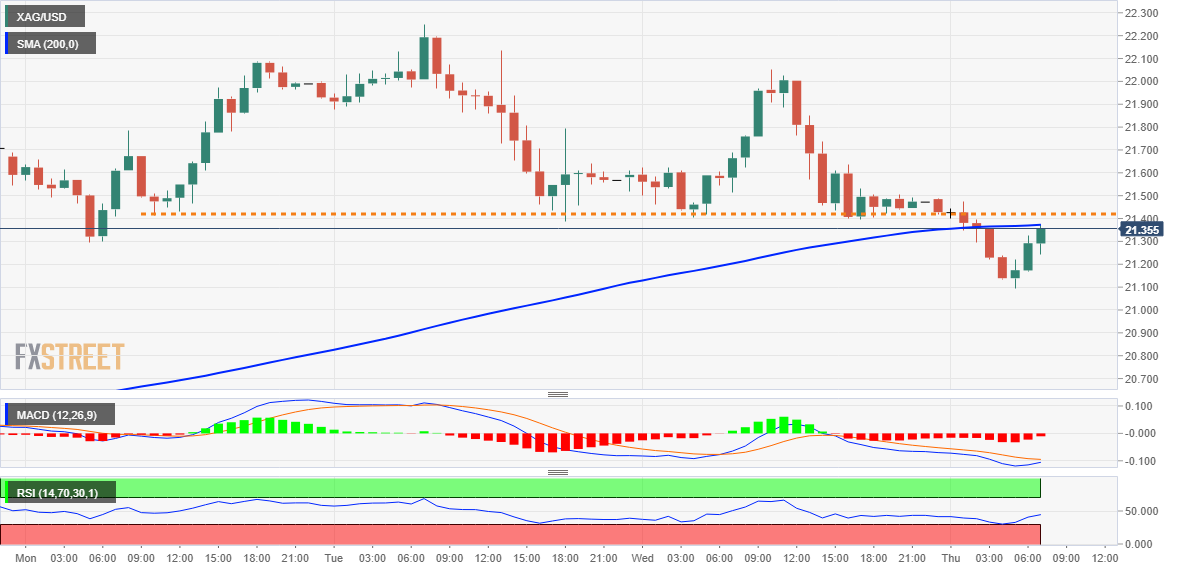
- A convincing break below the $21.00 level is needed to support the prospects for further losses.
Silver (XAGUSD) extends this week’s pullback from five-month highs and remains under some selling pressure for the third day in a row on Thursday. The white metal, however, finds some support above the $21.00 level and recovers part of its intraday losses to a one-week low. XAGUSD bounces steadily to the $21.35-$21.40 zone during the early part of the European session, though it lacks continuation and still looks vulnerable.
Repeated failures to find acceptance above the round $22.00 level and a subsequent pullback below the 200 hourly SMA suggest that the recent rally may have petered out. A sustained break below the $21.00 level will reaffirm the negative bias and pave the way towards the next relevant support near the $20.40-$20.35 zone. The corrective decline could extend and drag prices towards the psychological $20.00 level.
That being said, the oscillators on the daily chart, although they have pulled back, are still comfortably in bullish territory. This could prevent traders from entering aggressively short positions around XAGUSD and help limit deeper losses, at least for now.
Meanwhile, bullish strength beyond the immediate $21.40-$21.50 barrier could attract some sellers near the $21.70 horizontal barrier and remain capped around the $22.00 level. This is closely followed by the multi-month high around the $22.25 region, which if broken will set the stage for further gains. The XAGUSD could then accelerate the drive towards the $22.50-$22.60 zone and eventually recapture the $23.00 level.
Silver 1 hour chart
silver key levels
Source: Fx Street
I am Joshua Winder, a senior-level journalist and editor at World Stock Market. I specialize in covering news related to the stock market and economic trends. With more than 8 years of experience in this field, I have become an expert in financial reporting.


