
- Silver is developing a bullish leg within a range.
- The rise is helped by bullish convergence between price and momentum.
The Silver (XAG/USD) is trading within a wide range extending from $26 to $30. Within that range, it is oscillating within the confines of a smaller consolidation between approximately $27.70 and $29.20.
Silver 4 hour chart
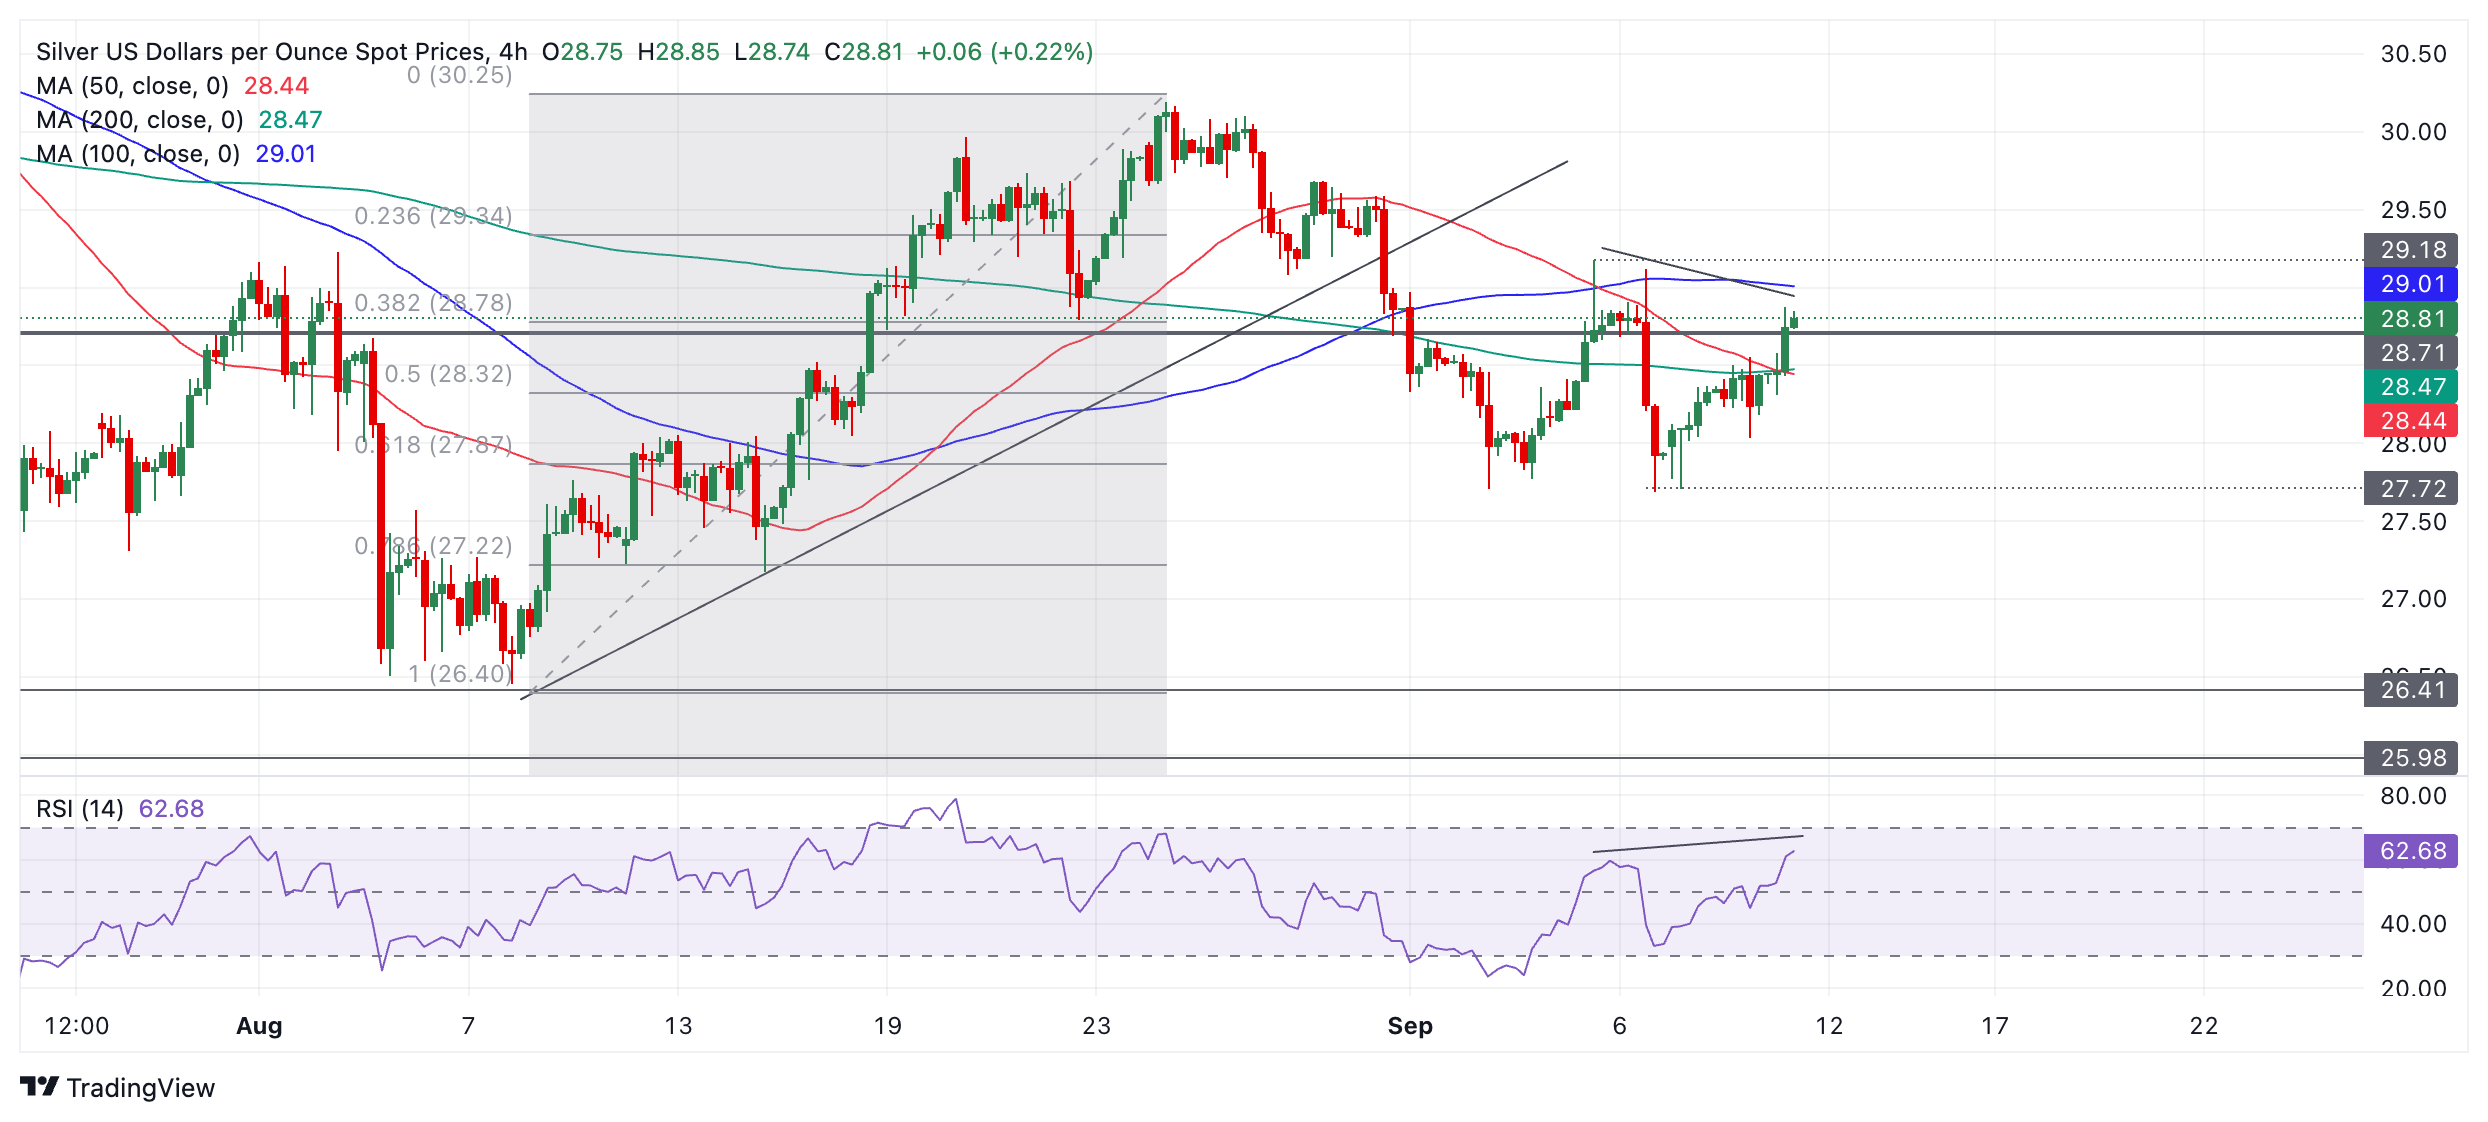
Silver is currently trading at $28.80 as it develops a bullish leg towards the top of the mini range. It will likely continue to rise until reaching around $29.18 (September 5 high).
The bullish move from the low of September 6 is accompanied by a bullish convergence with the Relative Strength Index (RSI) momentum indicator. The price is lower than that of September 5, but the RSI is higher. This indicates that the current bullish leg is accompanied by bullish conviction.
After reaching the top of this mini range, there is a chance that it can rotate and start moving back towards the bottom of $27.70.
Alternatively, a decisive breakout to the upside would signal a bullish continuation. Such a move would likely reach around $30.10 and the top of the larger range. The target is calculated by taking the 0.618 Fibonacci extension of the height of the smaller range and extrapolating it upwards, which is the standard technical method for forecasting a range breakout.
Source: Fx Street
I am Joshua Winder, a senior-level journalist and editor at World Stock Market. I specialize in covering news related to the stock market and economic trends. With more than 8 years of experience in this field, I have become an expert in financial reporting.


 music")

