
- Silver has found resistance at a trend line and is pausing after a bull run.
- It would need to make a decisive break above the trend line to continue its uptrend.
Silver (XAG/USD) has hit a key trend line at $30 and has stopped. It has seen several Doji candlestick patterns over the past few days. Doji are days when the price closes very close to the level at which it opened. This is a sign of market indecision.
Silver Daily Chart
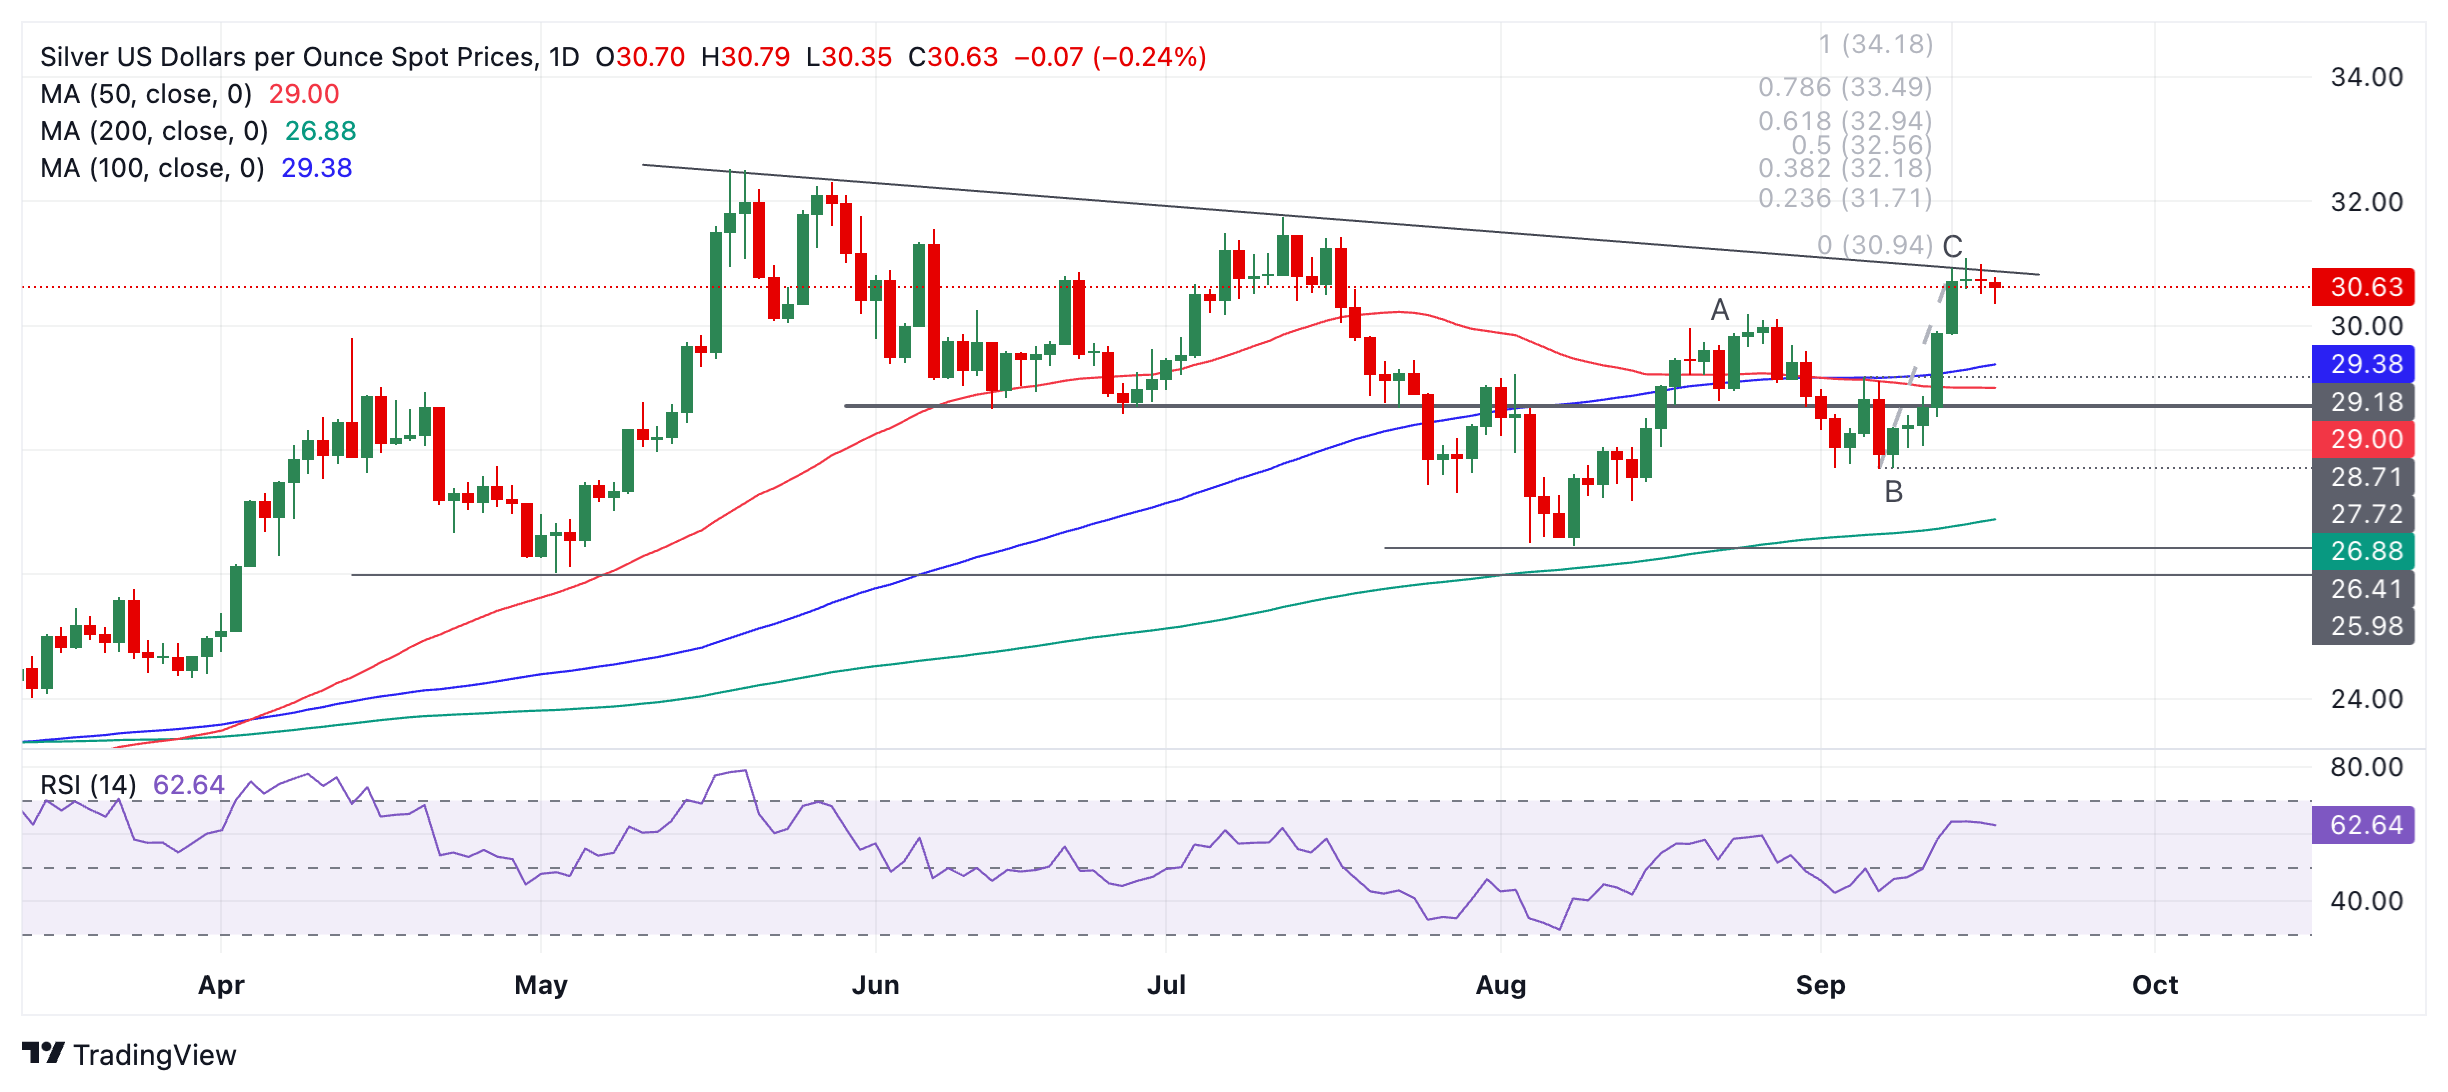
Silver has been in an uptrend since the lows in early August, although it also corrected during the second half of the month. As it is a tenet of technical analysis that “the trend is your friend,” the uptrend in Silver is more likely to extend. Therefore, it could go higher. A decisive break above the trend line would confirm a breakout and follow-through to $32.94, the .618 Fibonacci ratio of the C-leg extension.
A decisive breakout would be one accompanied by a long green candle that breaks clearly above the level and closes near its high, or three candles in a row breaking above the level.
Although the price action has formed several Doji candlesticks over the past few days, it has not formed a candlestick reversal pattern such as a Shooting Star, Bearish Engulfing, or Hanging Man, for example. Therefore, it is still too early to say that the precious metal will correct lower.
Silver has likely completed a measured moving pattern from the low on August 8. Such patterns consist of three zig-zag waves. It is another feature of these patterns that waves A and C are usually of similar length. In the case of Silver, A and C reached a similar length. This further suggests that prices will pause and rest for a while, or even reverse.
Source: Fx Street
I am Joshua Winder, a senior-level journalist and editor at World Stock Market. I specialize in covering news related to the stock market and economic trends. With more than 8 years of experience in this field, I have become an expert in financial reporting.


