
- The fall in Silver prices is limited to $27.50 and remains practically sideways on the day.
- US CPI supports Fed's 'higher hikes for longer' stance and crushes risk appetite.
- XAG/USD's broader uptrend remains intact with high $28.53 in bulls' sights
The reversal of prices Silver (XAG/USD) After stronger than expected inflation data in the US, it has been contained in the $27.50 area. The metal is regaining some ground as the dust settles from the US data, with the daily chart virtually flat.
Consumer prices unexpectedly accelerated in the US in March, with headline inflation at 0.4% versus expectations of 0.3%, while the annual rate rose to 3.5% from 3.2% in February. Likewise, core inflation accelerated to 0.4% from 0.3% the previous month, while the annual rate remained stable at 3.8%.
These figures confirm that price pressures remain stubbornly high, at levels well above the Fed's 2% target rate, dashing hopes of monetary easing in the coming months.
US Treasury yields spiked following the news, dragging the US dollar with them, although the negative impact on precious metals has been limited. Silver, in particular, has regained most of the ground lost following the release and is trading close to the daily open.
XAU/USD technical analysis
The overall bullish trend of XAU/USD remains intact, with no clear signs of correction so far, except for the bearish divergence on the RSI. Immediate support is at $27.57 and below here at $26.85. The resistances are $28.53 and the psychological level of $30.00.
XAG/USD 4-hour chart
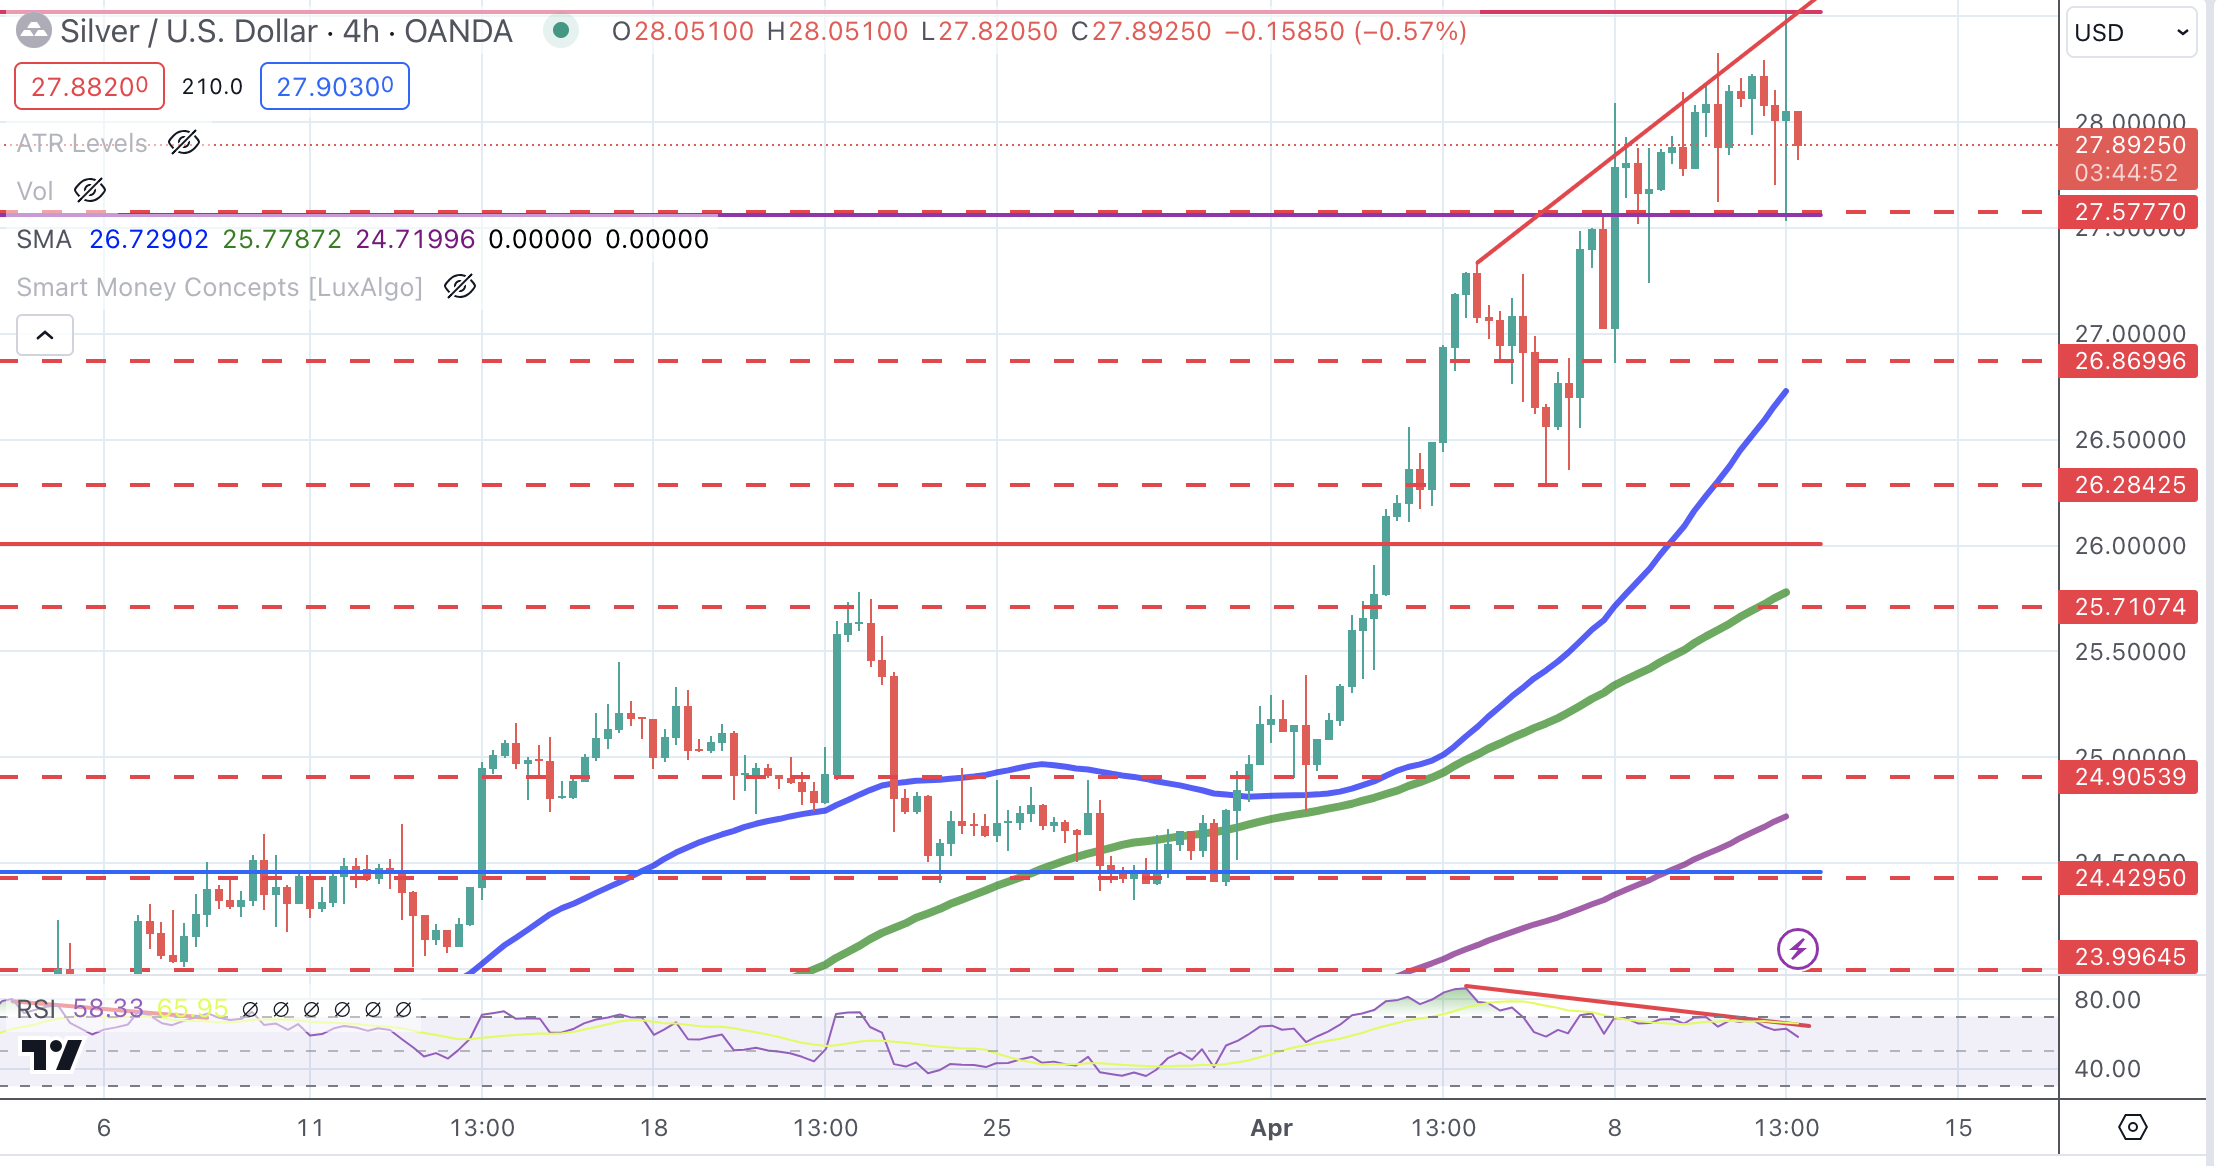
Source: Fx Street
I am Joshua Winder, a senior-level journalist and editor at World Stock Market. I specialize in covering news related to the stock market and economic trends. With more than 8 years of experience in this field, I have become an expert in financial reporting.


