
- The price of Silver rises to $24.70, while the general trend is sideways.
- Core PCE inflation will give clues to the Fed's rate cut schedule.
- Fed policymakers anticipate three rate cuts by the end of the year.
The price of Silver (XAG/USD) advances to $24.70 during the European session on Thursday. The white metal advances pending data on the personal consumption expenditure (PCE) price index for February in the United States, which will be published on Friday.
The underlying PCE will give clues as to when the Federal Reserve (Fed) will begin to reduce interest rates. It is estimated that the annual core inflation figure has grown steadily by 2.8% year-on-year, with monthly growth that has fallen to 0.3% from 0.4% in January.
Currently, market expectations indicate that the Fed will cut interest rates starting with the June policy meeting. Expectations also show there will be three rate cuts by the end of the year, as Fed policymakers projected at last week's policy meeting.
According to the CME's FedWatch tool, investors are pricing in a 64% chance that the Fed will cut interest rates in June.
Meanwhile, the US Dollar Index DXY retreats slightly from monthly highs of 104.50. In the last four sessions, the DXY Dollar Index has moved between 104.00 and 104.50. US core PCE inflation is expected to provide support for the DXY index to break consolidation.
Technical analysis of the price of Silver
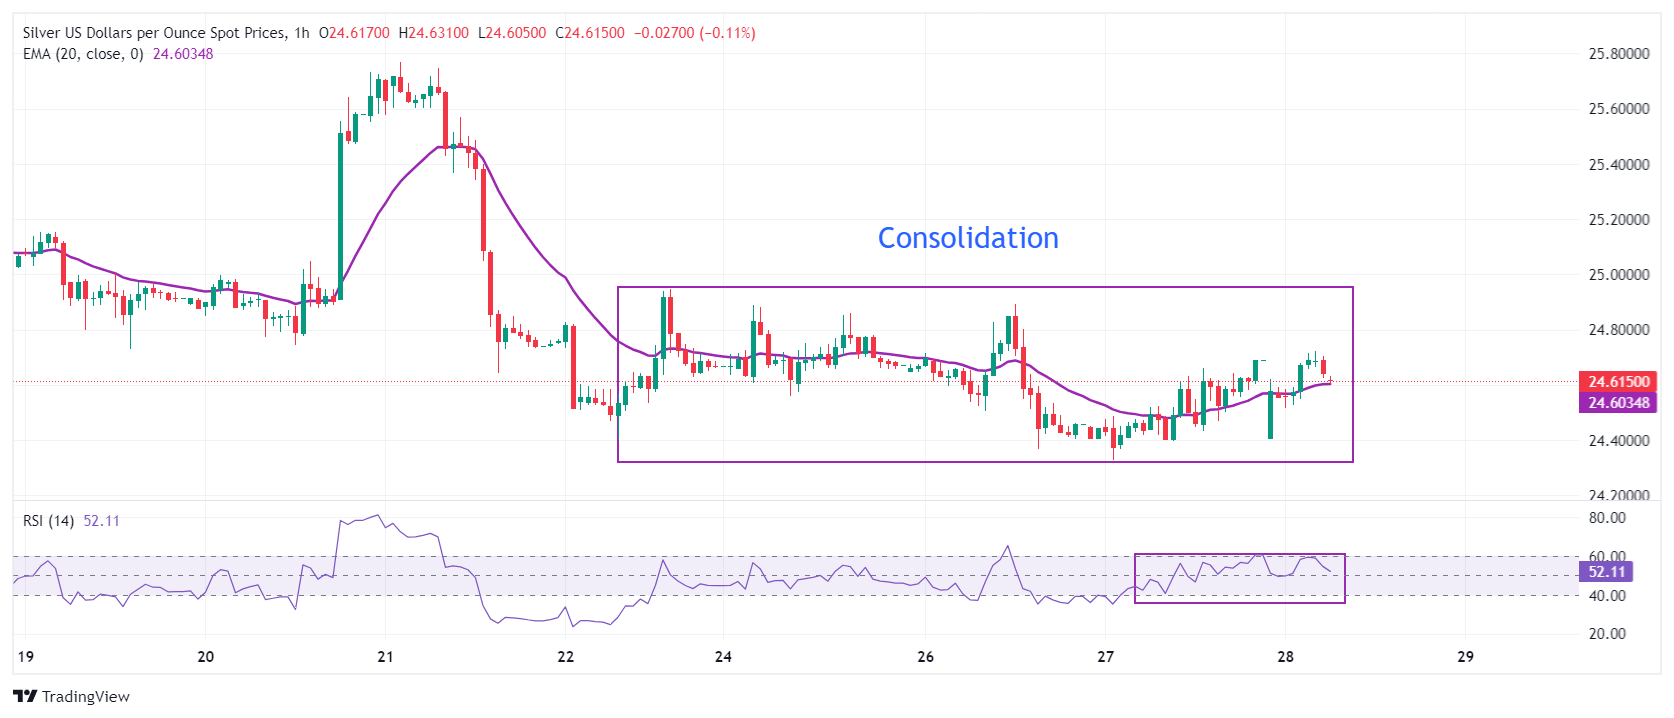
The price of Silver has consolidated in a range of $24.32-$25.00 for a week. This shows an indecision among market participants. The 20-period EMA at $24.60 remains close to the silver price movement, demonstrating a sideways trend.
The 14-period Relative Strength Index (RSI) is oscillating in the 40-60 zone, indicating a sharp contraction in volatility.
1 hour chart of the price of Silver
Source: Fx Street
I am Joshua Winder, a senior-level journalist and editor at World Stock Market. I specialize in covering news related to the stock market and economic trends. With more than 8 years of experience in this field, I have become an expert in financial reporting.


