
- The S&P500 shows a loss of 1.69%, weekly.
- Nonfarm payrolls were 114,000, lower than the estimated 175,000.
- The unemployment rate stood at 4.3% in July, exceeding analysts’ forecasts.
The S&P 500 hit a daily high of 5,421 during the European session, attracting sellers who drove the index to a daily low of 5,346. At the time of writing, the S&P 500 is trading at 5,369, losing 1.45% on the day.
US Nonfarm Payrolls Miss Expectations
According to data from the U.S. Department of Labor, 114,000 nonfarm payrolls were created in July, well below the market consensus of 175,000 and the 206,000 created in June.
Similarly, the unemployment rate has increased to 4.3% from a previously forecast 4.1%, reaching its highest reading since October 2021. The labor force participation rate registered a marginal increase to 62.7% from 62.6% in June.
The S&P 500 is down for the third consecutive week after hitting a record high of 5,667 on July 16.
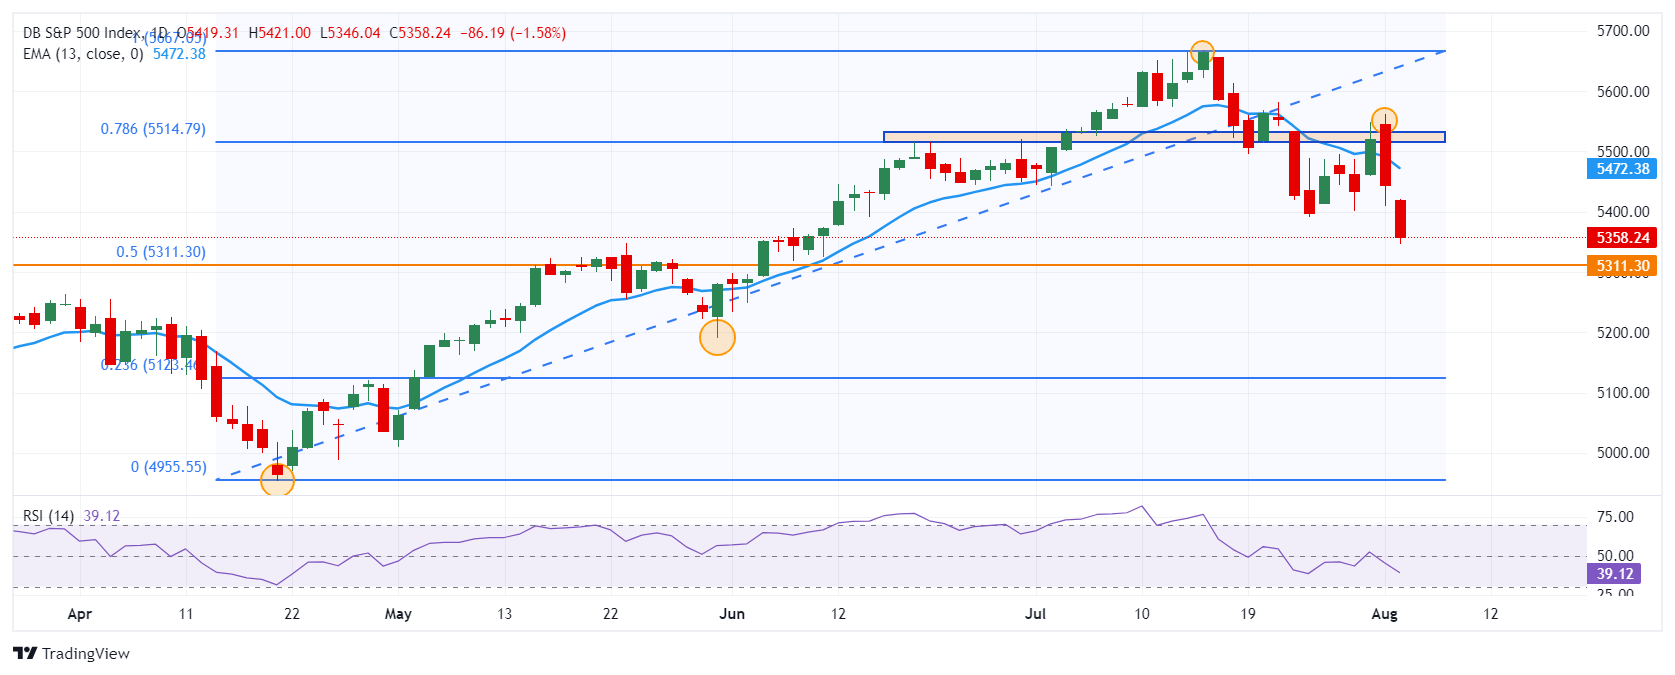
Levels to consider in the S&P 500
The S&P 500 is in a short-term downtrend, establishing resistance at 5,560, given the high of August 1. The first support zone is located at 5,310, the low of June 7 that converges with the 50% Fibonacci retracement. The next support is observed at 4,953, the pivot point of April 19. The relative strength index shows us that the SP 500 is approaching oversold levels, located at 39 below the midline of 50.
S&P 500 daily chart
Source: Fx Street
I am Joshua Winder, a senior-level journalist and editor at World Stock Market. I specialize in covering news related to the stock market and economic trends. With more than 8 years of experience in this field, I have become an expert in financial reporting.


