
- The S&P 500 lost 0.21% on Tuesday after falling below the lower trend line on Monday.
- The index should maintain the bullish trend until the support of 4,818 points.
- Bitcoin Halving and Israeli Tensions Threaten to Force a Market Correction.
- Persistent inflation and the strength of the economy make the market postpone the first rate cut until September.
The S&P 500 appears to have suffered a breakout this week. The previous week, the index retreated as expectations for a Federal Reserve (Fed) rate cut were reduced, but on Monday of this week there was a clear break and close below the lower trend line of the price channel in force since October 2023.
The index fell 0.21% on Tuesday, following Monday's 1.2% sale and last Friday's 1.46% decline. US Treasury yields rose again by more than 1% between the 2- and 30-year maturities. The 2-year bond ended the day at 5%, again at the level it left in November of last year.
S&P 500 News: Index Faces Middle East Concerns, BTC Halves, Retail Sales Rise More Than Expected
Several narratives are colliding in such a way in the last week that they have made the stock market toxic at a time when analysts are increasingly bullish on the S&P 500.
These factors are reducing expectations that the Fed will cut short-term interest rates, increasing chances of a regional war in the Middle East, and the upcoming Bitcoin halving, which could refocus investors. equity bulls in the short-term cryptocurrency market.
First, retail sales rose 0.7% in March on a monthly basis on Monday. This figure was below the previous month's 0.9%, but well above expectations of 0.3%. These figures show an economy that is far from weak, and traders see this strong data as a sign that inflation is unlikely to reach the Fed's basic 2% target.
Last week's Consumer Price Index (CPI) data did not please traders, who hoped a lower reading would give the central bank enough reason to cut interest rates in July. CME Group's FedWatch tool now expects the central bank not to cut rates until September.
This has pushed up US Treasury yields, which tend to invert relative to equity market indices.
Then there is the current situation in Israel. After the country, at war with Hamas since last October, bombed an Iranian consulate in defiance of international law, the Iranian regime pre-announced an airstrike against Israeli military assets over the weekend.
Although Iran said its aggression was over, and US officials have sought to curb further Israeli outbursts, Israel has continued its saber-rattling this week. Rumors have emerged that there is an Israeli plan to continue attacking Iranian assets. The market fears that this aggression will lead to a full-blown regional war that will skyrocket the price of oil.
There is also the issue of Bitcoin. The fourth Bitcoin halving is here. It is scheduled to take place on April 19 or 20, when Bitcoin mining rewards will be halved from 6.25 BTC per block to 3.125. In the past, each halving event has caused a sharp rise in the value of Bitcoin, as BTC becomes scarcer as it becomes more expensive to mine.
Expect a large number of equity traders to refocus on the cryptocurrency market in the coming weeks as BTC ETFs have made it easier for traders to move between asset classes.
Forecasts for the S&P 500
The S&P 500 index broke and closed below the lower trend line on Monday. This trend line was drawn parallel to the upper trend line, which features more historical repeats over the past six months. The price channel began in October 2023, and represents the steady accumulation trading that the market has witnessed since then.
Monday's breakout and Tuesday's continued decline herald a period of decline. The S&P 500 is likely to remain stagnant or bearish until the index reaches the 4,818 level.. That resistance level was once the all-time high in December 2021 before resurrecting as resistance once again in January of this year.
The 9-day simple moving average has broken below its 20-day counterpart, confirming that this pullback has a way to go. This price level can be expected to be reached particularly quickly if Iran or Israel intensify their military activities.
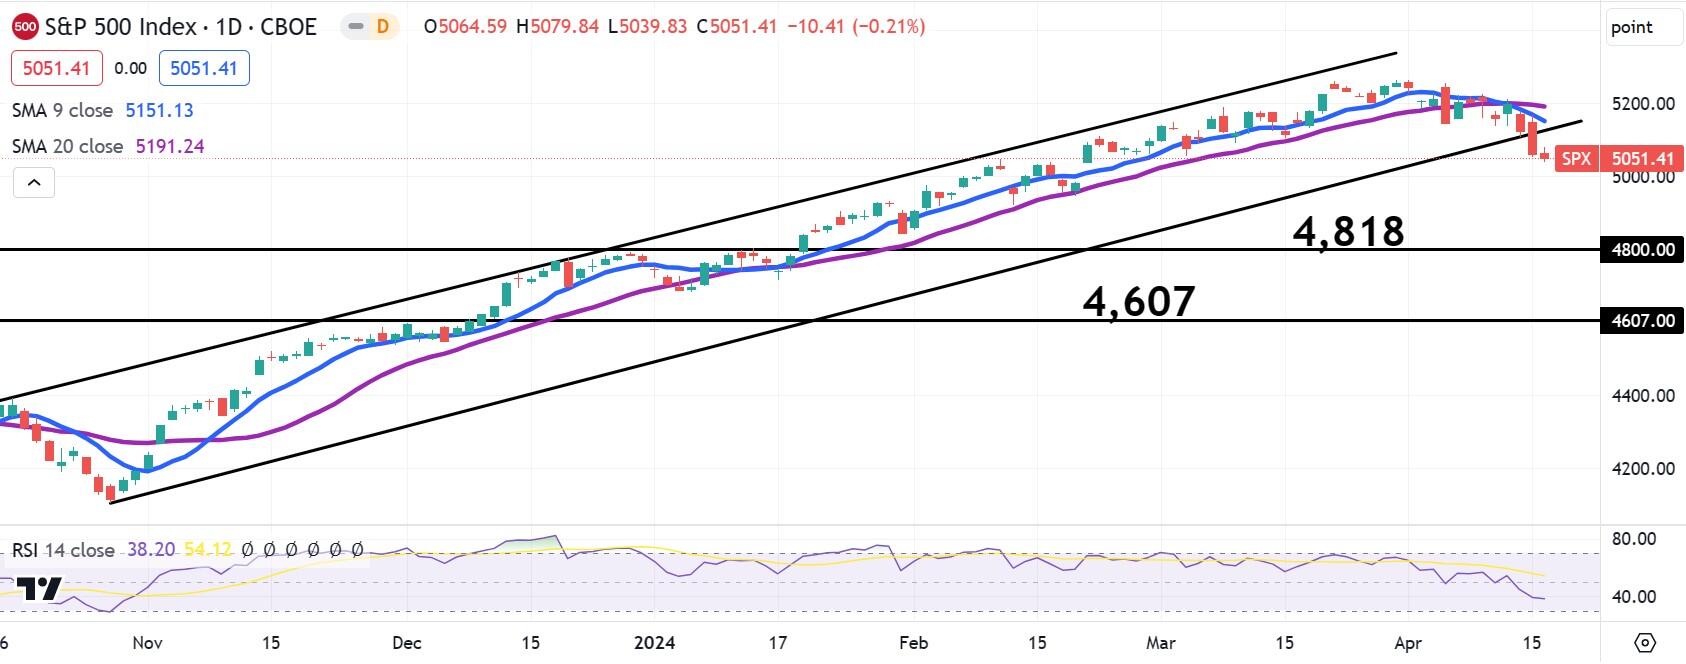
S&P 500 daily chart
Frequently asked questions about the S&P 500
What is the S&P 500?
The S&P 500 is a widely followed stock index that measures the performance of 500 public companies and is considered a broad measure of the U.S. stock market. The influence of each company in the calculation of the index is weighted based on market capitalization. This is calculated by multiplying the number of listed shares of the company by the share price. The S&P 500 Index has achieved impressive returns: $1.00 invested in 1970 would have produced a return of almost $192.00 in 2022. The average annual return since its inception in 1957 has been 11.9%.
How are companies chosen to be included in the S&P 500?
Companies are selected by committee, unlike other indices where they are included based on established standards. Still, they must meet certain eligibility criteria, the most important of which is market capitalization, which must be equal to or greater than $12.7 billion. Other criteria are liquidity, domicile, market capitalization, sector, financial viability, listing time, and representation of the sectors of the United States economy. The nine largest companies in the index represent 27.8% of the index's market capitalization.
How can I trade the S&P 500?
There are several ways to trade the S&P 500. Most retail brokers and spread betting platforms allow traders to use Contracts for Difference (CFDs) to place bets on price direction. In addition, you can buy index funds, mutual funds and exchange-traded funds (ETFs) that track the price of the S&P 500. The most liquid of the ETFs is the London Stock Exchange ETF. The most liquid of the ETFs is State Street Corporation's SPY. The Chicago Mercantile Exchange (CME) offers futures contracts on the index and the Chicago Board of Options (CMOE) offers options, as well as ETFs, inverse ETFs, and leveraged ETFs.
What factors drive the S&P 500?
There are many factors that drive the S&P 500, but primarily it is the aggregate performance of its component companies, revealed in their quarterly and annual earnings reports. US and global macroeconomic data also contribute, influencing investor sentiment, which if positive, drives earnings. The level of interest rates, set by the Federal Reserve (Fed), also influences the S&P 500, as it affects the cost of credit, on which many companies largely depend. Therefore, inflation can be a determining factor, as well as other parameters that influence the decisions of the Federal Reserve.
Source: Fx Street
I am Joshua Winder, a senior-level journalist and editor at World Stock Market. I specialize in covering news related to the stock market and economic trends. With more than 8 years of experience in this field, I have become an expert in financial reporting.


