
- The S&P 500, the Nasdaq 100 and the Dow Jones plunged as the crisis in the banking system deepened.
- The US Producer Price Index cooled, while Retail Sales fell after an excellent report in January.
- Investors expect the Federal Reserve to keep the Fed Funds Rate unchanged at the next meeting.
Wall Street plunged as the banking crisis deepened, with Credit Suisse (CS) stock plunging 24% on the day, amid comments from its largest shareholder not to invest in the bank for “regulatory and statutory reasons.” This has caused CS values to plunge, while its Credit Default Swaps (CDS) are reaching levels last seen since the Global Financial Crisis (CFG).
Thus, the S&P 500 fell 1.46%, to 3,862.14 points. It is followed by the Nasdaq 100, which falls 0.76%, to 11,342.55 points, while the Dow Jones loses 1.74%, to 31,598.13 points.
Sentiment remains sour amid Credit Suisse panic selling. Bank stocks around the world posted losses, while more than 80% of S&P 500 stocks are trading lower. On the other hand, the United States (USA) economic calendar published Retail Sales and the Producer Price Index (PPI) for February. Retail Sales came in below the expected slump of 0.3%m/m, falling 0.4%, partly due to January’s surprising 3.2% report.
The US Producer Price Index (PPI) fell 0.1% month-on-month, the US Bureau of Labor Statistics reported today. Core PPI, which excludes volatile items such as Food and Energy, cooled from estimates of 0.4% to 0%.
Meanwhile, expectations of a 25 basis point rate hike by the Federal Reserve (Fed) had subsided. According to CME’s FedWatch tool, the odds of a 25 basis point hike stand at 37%, with investors estimating no change to the FFR at next week’s meeting.
By sectors, Public Services and Communications are the two leaders of the pack, with increases of 1.16% and 0.25%. The furthest behind are Energy and Materials, which lost 6.18% and 4.42% respectively.
Meanwhile, the dollar is recovering after three days of consecutive losses, as shown by the Dollar Index, which is up 1.21% to 104.937. US Treasury yields continued to fall along the curve, with the 2-year yield down 43 basis points to 3.823%, while the 10-year yield fell 28 basis points to 3.410 %.
To consider
Figures for February on housing starts, building permits and initial claims for unemployment benefits will be published in the US economic calendar.
SP500 daily chart
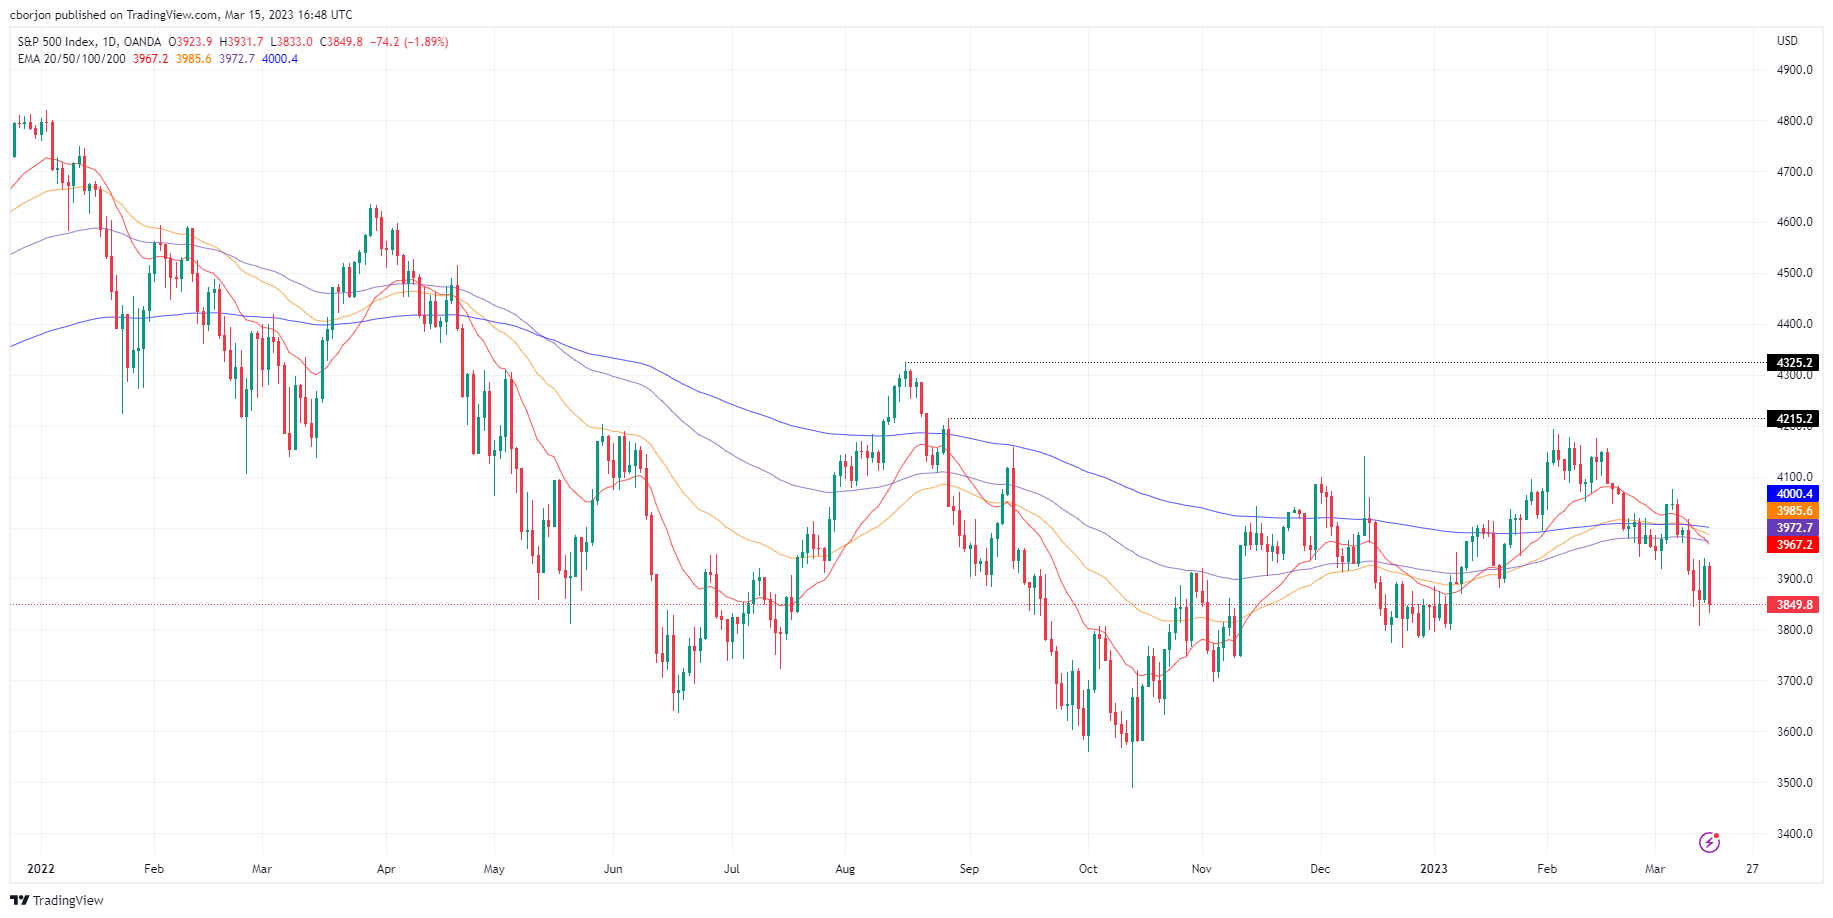
Source: Fx Street
I am Joshua Winder, a senior-level journalist and editor at World Stock Market. I specialize in covering news related to the stock market and economic trends. With more than 8 years of experience in this field, I have become an expert in financial reporting.


