
In a day where attention is focused on economic indicators and the statements of financial leaders, the index S&P 500 shows signs of resilience. The S&P 500 is trading at 5,104.72 points at the time of writing this news, gaining 0.51% on the day. The American index began the day with a value of 5,097.18 points. The range fluctuated between 5,093.28 points and 5,109.39 points.
The S&P 500 points higher
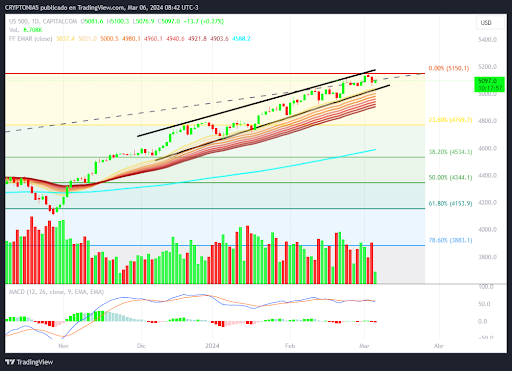
Continued bullish trend: The daily chart of the S&P 500 continues to point up, with no clear signs of reversal. Investors maintain their confidence in the market, confirming that the upward trend persists despite the recent correction of the American index. Additionally, business results have been strong overall, with S&P 500 companies exceeding expectations in many cases.
Firm MACD Indicator: The Moving Average Convergence/Divergence (MACD) indicator shows no signs of trend reversal at this time. This suggests that buyers remain dominant and market strength remains intact.
Current quote: At the time of writing this news, the S&P 500 index is trading at 5,104.72 points, experiencing an increase of 0.51% during today's trading.
Potential support: In case of a downward correction, the 25-period moving average 5,090.20 points on the daily chart could act as support, preventing a steeper decline.
S&P 500 daily chart
Jerome Powell's testimony could generate volatility in the S&P 500
- The United States published its private employment data today ADP: The United States private employment report prepared by Automatic Data Processing (ADP) has shown a creation of 140,000 jobs during the month of February, below the 150,000 expected. The January figure has been revised upwards, rising to 111,000 compared to the 107,000 published a month ago.
- Powell's testimony: Federal Reserve Chairman Jerome Powell will appear before Congress, and his comments could affect the direction of the Index.
On the other hand, technology companies experienced slight setbacks yesterday, Tuesday, March 5, awaiting today's key events:
- Apple: -2.84%
- Microsoft: -2.96%
- Meta (formerly Facebook): -1.60%
- Amazon: -1.95%
Frequently asked questions about the S&P 500
What is the S&P 500?
The S&P 500 is a widely followed stock index that measures the performance of 500 public companies and is considered a broad measure of the U.S. stock market. The influence of each company in the calculation of the index is weighted based on market capitalization. This is calculated by multiplying the number of listed shares of the company by the share price. The S&P 500 Index has achieved impressive returns: $1.00 invested in 1970 would have produced a return of almost $192.00 in 2022. The average annual return since its inception in 1957 has been 11.9%.
How are companies chosen to be included in the S&P 500?
Companies are selected by committee, unlike other indices where they are included based on established standards. Still, they must meet certain eligibility criteria, the most important of which is market capitalization, which must be equal to or greater than $12.7 billion. Other criteria are liquidity, domicile, market capitalization, sector, financial viability, listing time, and representation of the sectors of the United States economy. The nine largest companies in the index represent 27.8% of the index's market capitalization.
How can I trade the S&P 500?
There are several ways to trade the S&P 500. Most retail brokers and spread betting platforms allow traders to use Contracts for Difference (CFDs) to place bets on price direction. In addition, you can buy index funds, mutual funds and exchange-traded funds (ETFs) that track the price of the S&P 500. The most liquid of the ETFs is the London Stock Exchange ETF. The most liquid of the ETFs is State Street Corporation's SPY. The Chicago Mercantile Exchange (CME) offers futures contracts on the index and the Chicago Board of Options (CMOE) offers options, as well as ETFs, inverse ETFs, and leveraged ETFs.
What factors drive the S&P 500?
There are many factors that drive the S&P 500, but primarily it is the aggregate performance of its component companies, revealed in their quarterly and annual earnings reports. US and global macroeconomic data also contribute, influencing investor sentiment, which if positive, drives earnings. The level of interest rates, set by the Federal Reserve (Fed), also influences the S&P 500, as it affects the cost of credit, on which many companies largely depend. Therefore, inflation can be a determining factor, as well as other parameters that influence the decisions of the Federal Reserve.
Source: Fx Street
I am Joshua Winder, a senior-level journalist and editor at World Stock Market. I specialize in covering news related to the stock market and economic trends. With more than 8 years of experience in this field, I have become an expert in financial reporting.


