
- The S&P 500, Nasdaq 100 and Dow Jones rose as traders braced for US retail sales.
- US inflation cooled on a yearly basis, but on a monthly basis, the core CPI is advancing.
- Investors expect the Federal Funds Rate to peak around 5%.
Wall Street It is trading with solid gains, recovering after Monday’s volatile session, sponsored by the US regional banking crisis, which threatens to spread to other banks. However, the measures to contain the bankruptcy of Silicon Valley Bank (SVB) seemed to cushion the fall in risk assets.
At the time of writing these lines, the S&P 500 gains 0.72 to 3,883.55 points. It is followed by the high-tech Nasdaq 100, which is up 1.20% at 11,322.69, while the Dow Jones is up 0.22% at 31,891.57.
US stock indices and US bond yields gain ground, and the dollar falls
Despite the ongoing banking crisis, the latest economic data from the United States (US) would likely keep the US Federal Reserve (Fed) in a tightening mode. US inflation was fairly in line with estimates, although on a monthly basis the core Consumer Price Index (CPI) for February came in at 0.5%, above forecasts of 0.4%. Headline inflation, the CPI, was 0.4% mom, in line with estimates. Headline and core inflation data were below estimates, showing the effect of the rise in interest rates.
Meanwhile, expectations of a 25 basis point rate hike by the Federal Reserve (Fed) remained high. However, events surrounding the latest US banking crisis could influence the decisions of Fed officials next Wednesday. The odds of a 25 basis point rise on CME’s FedWatch tool stand at 65% in the 4.75% – 5.00% range.
By sectors, communication services and the financial sector are the two leaders of the pack, with increases of 2.13% and 1.76%. The most lagging sectors are Basic Consumer Goods and Real Estate, which rose 0.16% and 0.11% respectively.
Lately, geopolitical unrest over a Russian plane crashing with a US drone has exacerbated a further slide in US stocks.
US Treasury yields are recovering, led by 2-year and 10-year yields, which rose 7% and 1.76% respectively. The Dollar Index (DXY) parted from its earlier gains and was down 0.04% to 103.581.
What must be considered?
The Producer Price Index (PPI) for February and Retail Sales will be published in the US economic calendar. The New York Empire State Manufacturing Index for March and the NAHB Housing Market Index will also be released.
S&P 500 daily chart
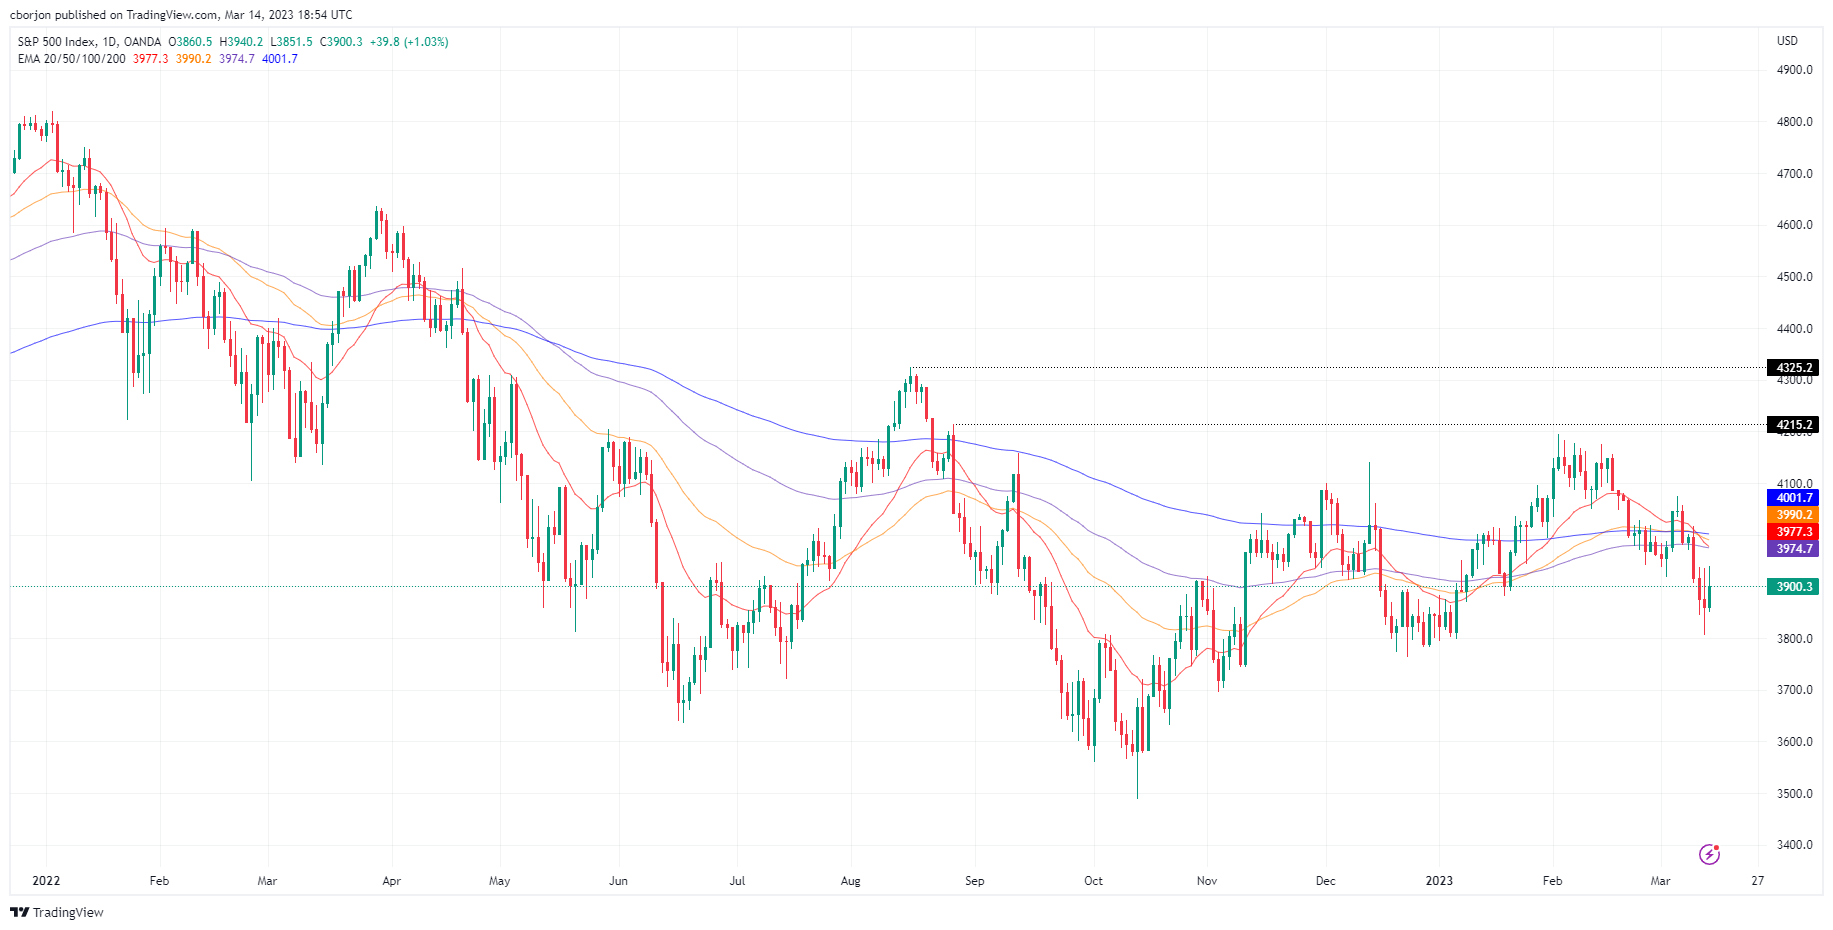
Source: Fx Street
I am Joshua Winder, a senior-level journalist and editor at World Stock Market. I specialize in covering news related to the stock market and economic trends. With more than 8 years of experience in this field, I have become an expert in financial reporting.


