
- US stocks rise ahead of monetary policy decisions from the Federal Reserve, which is expected to raise its rates by 75 basis points.
- The Nasdaq Composite leads the gains, followed by the S&P 500 and the Dow Jones.
- The dollar index falls, weighed down by lower US Treasury yields.
US equities recovered some ground after a five-day run of losses and gain between 1.05% and 1.54% on Wednesday as investors await the Fed’s monetary policy decision, with most estimates pointing to to a rate hike of 75 basis points.
Risk appetite increased, but for how long?
The S&P 500 rises 1.12% and stands at 3,776.07 points, followed closely by the Nasdaq Composite technology index, which rises 1.31% and stands at 11,459.56 points. At the bottom of the table is the Dow Jones Industrial Average, up 0.95% and standing at 30,654.16 points.
US retail sales posted their first drop in five months, down 0.3% mom; Excluding cars and gasoline, they were up 0.1%. It should be noted that the April figures were revised down, but remained positive. Meanwhile, if the figures are compared in annual terms, retail sales increased to 8.1%, up from 7.8% in April.
Meanwhile, the dollar index retreats from a 20-year high and stands at 105.318, shedding 0.15%. US Treasury yields remain high, but have come down. The 10-year note stands at 3,398%, down eight basis points.
Market sentiment is positive but remains fragile. Although Wall Street has adjusted its forecasts to 75 basis points, some voices suggest that the Fed would have to move 1% in order to restore the “credibility” of the central bank. However, such a large move would sour the mood, and equities could continue to slide lower.
In terms of specific sectors, the main gainers are Consumer Discretionary, up 1.75%, followed by Real Estate and Technology, which post gains of 1.34% and 1.27%, respectively. The main losers are Energy, Materials and Consumer Goods, which lose 1.45%, 0.05% and 0.01% each.
In the commodity complex, US benchmark oil WTI loses 0.94%, trading at $117.90 BPD, while precious metals like gold (XAU/USD) gain 0.70%, changing hands to $1,820.86 a troy ounce as US Treasury yields fall ahead of FOMC decision.
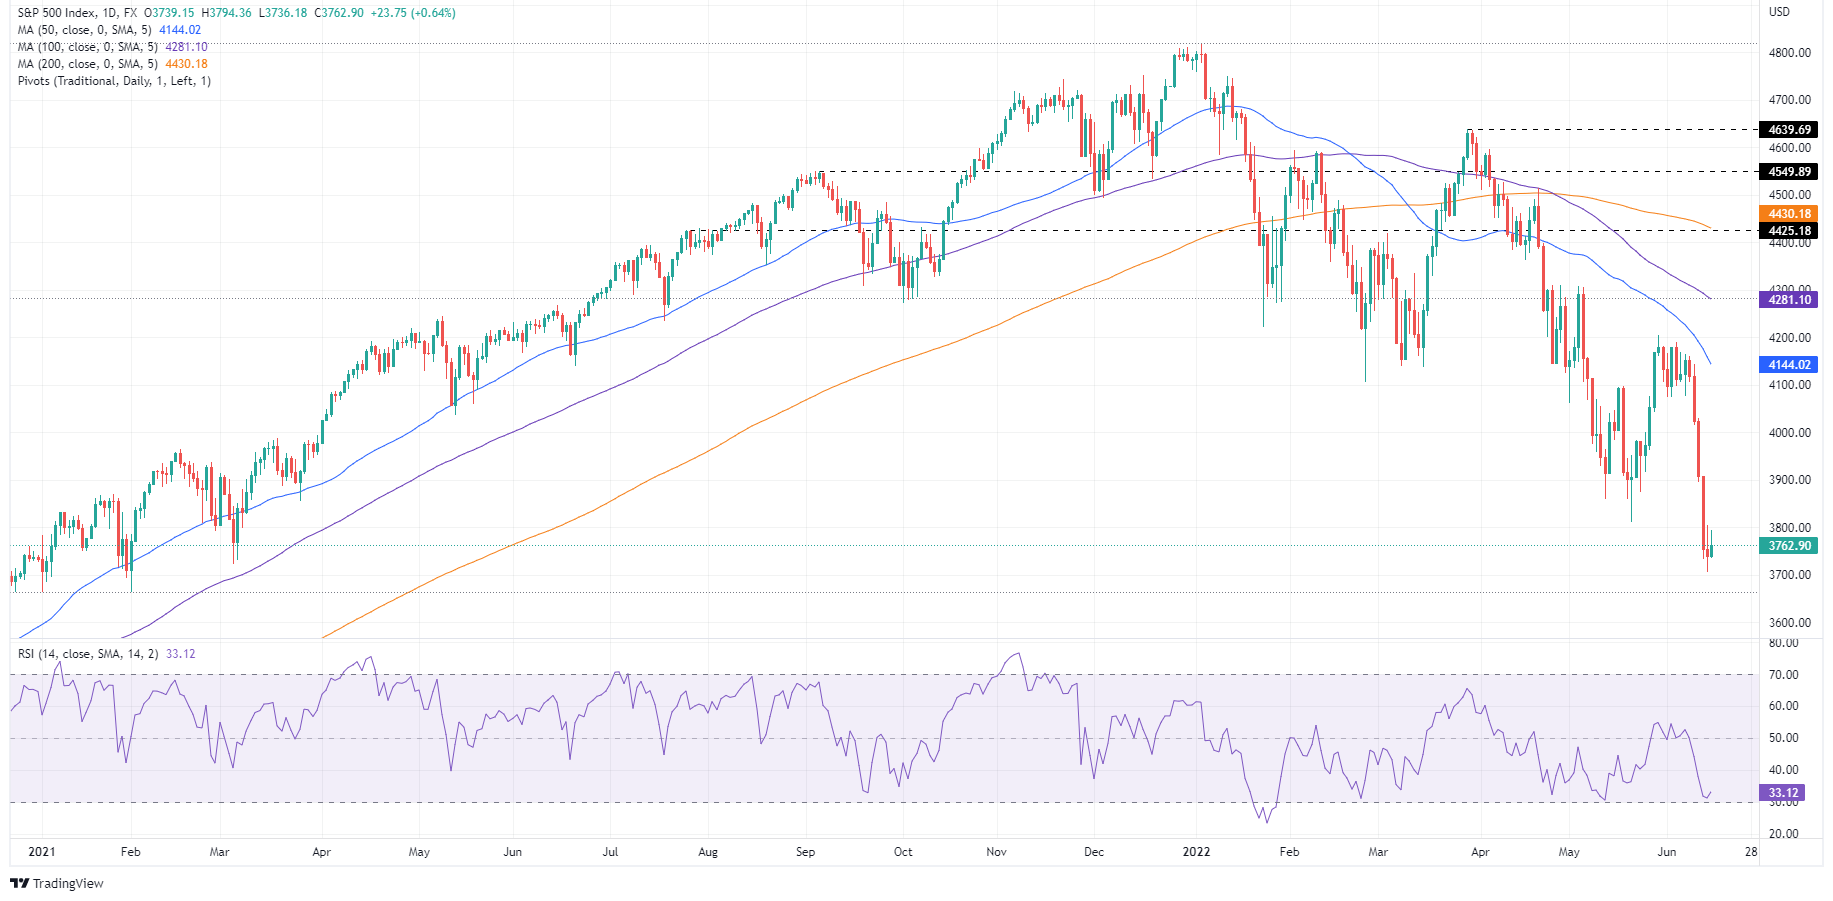
S&P 500 Daily Chart
Technical Levels
Source: Fx Street
With 6 years of experience, I bring to the table captivating and informative writing in the world news category. My expertise covers a range of industries, including tourism, technology, forex and stocks. From brief social media posts to in-depth articles, I am dedicated to creating compelling content for various platforms.


