
- This Wednesday, US equities rise between 0.24% and 0.87%.
- Fed Chairman Powell: “The Fed is strongly committed to bringing inflation back down, moving quickly to do so.”
- The Nasdaq Composite leads the gains, followed by the S&P 500 and the Dow Jones.
- USD and US Treasury yields fall despite hawkish comments from Fed’s Powell.
US stocks remain on the rise despite the aggressive line speech by Federal Reserve Chairman Jerome Powell, who takes the podium of the US Senate Banking Committee this Wednesday, as the American session began .
At the time of writing, the S&P 500 has moved away from hostile territory, posting minimal gains of 0.34% to 3,780.63, while the Nasdaq Composite leads the gainers, up 0.87% to 11,165, 14. For its part, the Dow Jones Industrial Average (DJIA) rose 0.24%, advancing to 30,602.45.
As for the sectors, those that gain are Consumer Discretionary, which rises 1.38%, followed by Communications Services and Real Estate, which register gains of 1.27% and 1.25%, respectively. The main losers are Energy, Materials and Industrials, which fall 3.02%, 0.84% and 0.30% each.
For its part, the US dollar index extends its weekly losses and plummets to 104,165, down 0.25%. US Treasury yields remain high but down, with the US 10-year note hovering around the 3.149% level, down twelve basis points.
Fundamentally nothing has changed, although stocks continue to push higher, despite US Federal Reserve Chairman Jerome Powell saying the Fed is “strongly committed to bringing inflation back down.” Furthermore, he added that data and decisions will determine the pace of rate hikes, which will be done “meeting by meeting.”
In the commodity complex, benchmark US crude, WTI, plummeted 4.53%, changing hands at $104.47 BPD. At the same time, precious metals such as gold (XAU/USD) were up 0.26%, trading at $1,843.70 a troy ounce.
SP 500 Chart
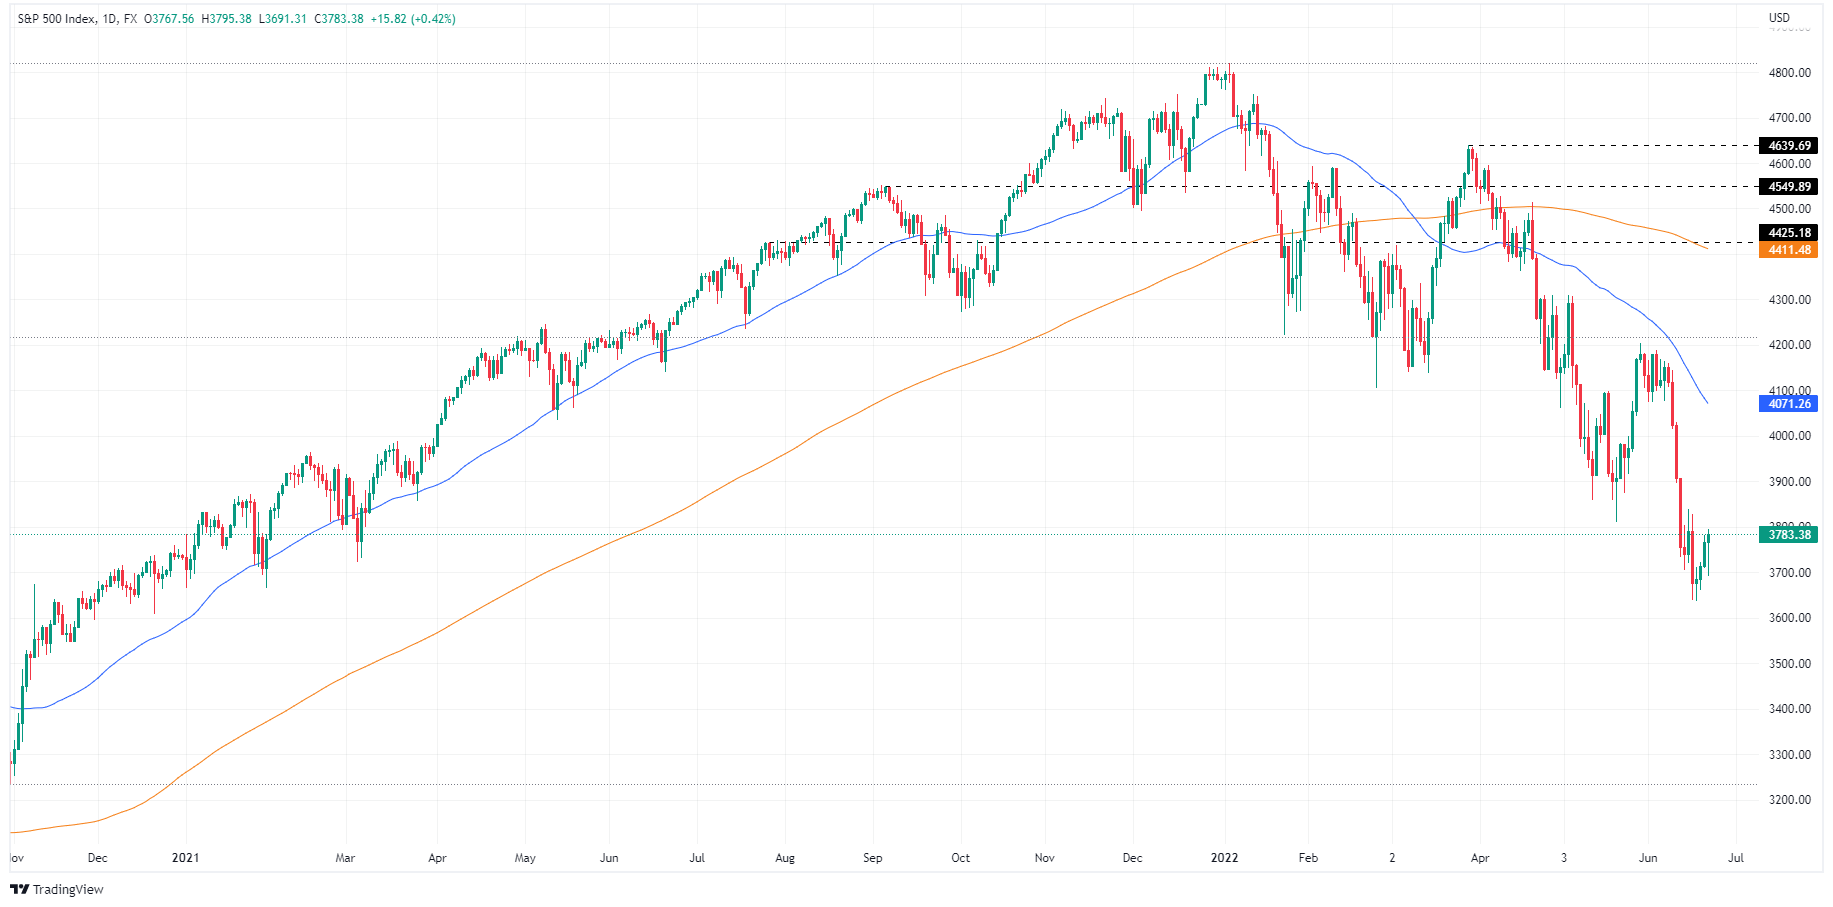
Technical levels
Source: Fx Street
With 6 years of experience, I bring to the table captivating and informative writing in the world news category. My expertise covers a range of industries, including tourism, technology, forex and stocks. From brief social media posts to in-depth articles, I am dedicated to creating compelling content for various platforms.


.jpeg "Nature holidays: on a sailing boat to the Pontine Islands with WWF experts")
.jpg "Megan Fox and “compartmentalization”, the self-defense mechanism that was triggered after suffering violence")